Hazily Constructing

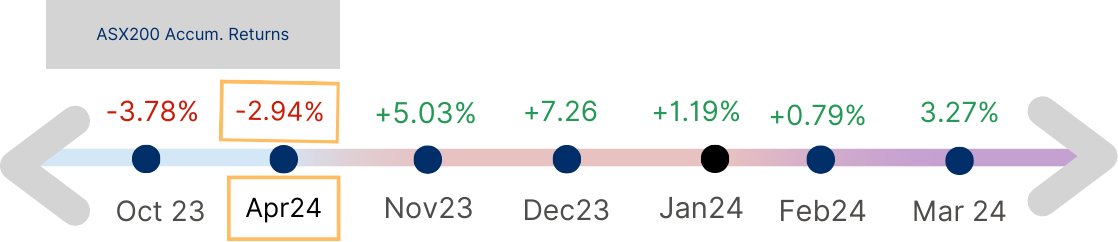
Figure 1: Stock Market Movement Scale
AcuView April 2024
April brought a first dip into the red in five months after a total rally of 17.5% (including dividends). As we move into mid May, we observed markets bucked the April mood and have reversed back up. Let’s evaluate three top of mind questions; Is this positive trend sustainable, Have I missed the rally and Should I be investing more of the same for the rest of year?
Are these all sustainable?
a. US corporate earnings are supportive
Majority of companies in S&P 500 have reported Q124 earnings and have demonstrated resilience. Despite slower Q124 economic growth, consumer spending has been healthy. Analysts have followed by upgrading EPS growth by 5.3% year-on year, with increase expected to come from margins expansion. Chart 1 shows a jump in EPS growth estimates in the first 3 months of 2024 for companies in S&P 500.
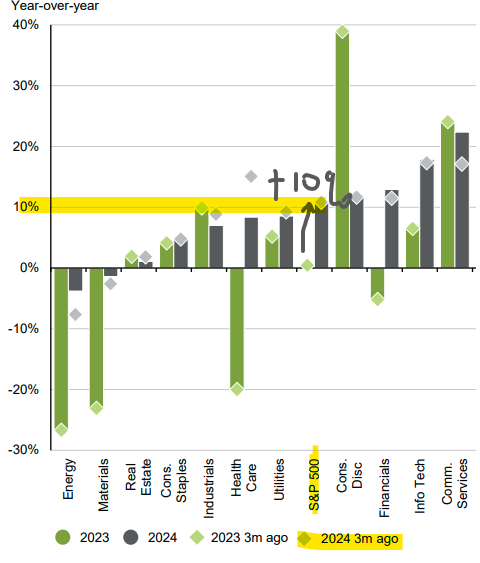
Chart 1: S&P 500 EPS growth estimates; Source: FactSet, Standard & Poor’s, J.P. Morgan AM Guide to Markets - Australia. Data as of 10 May 2024.
Analysts are expecting earnings improvement (from moderating wage inflation and input costs) to go beyond the Magnificent 7 stocks (Chart 2 right blue bar).
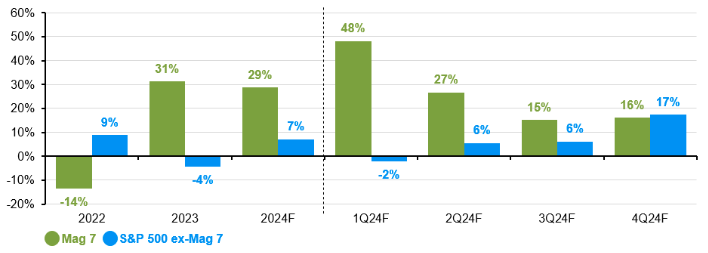
Chart 2: Earnings growth. Pro-forma EPS, year-on-year % change; Source: FactSet, Standard & Poor’s, J.P. Morgan AM. Data as of 2 May 2024.
Note: Magnificent 7 includes AAPL, AMZN, GOOG, GOOGL, META, MSFT, NVDA and TSLA. Earnings estimates for 2024 are forecasts based on consensus analyst expectations.
This is good news for investors as they can more confidently diversify outside of the large caps to smaller cap stocks that have good earnings growth and resilience. This is also a prudent risk management strategy. As observed by Innova Asset Management in its latest quarterly review, price growth of the Magnificent 7 have far outweigh their positive earning revisions (Chart 3), especially Meta.
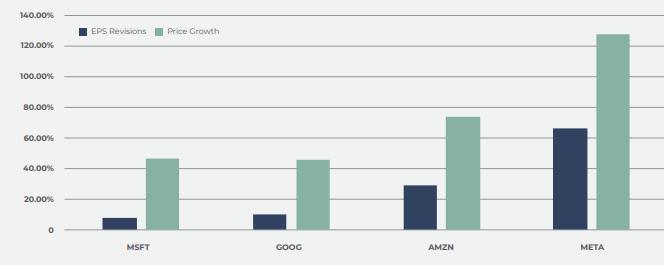
Chart 3: Change in earnings forecast vs share price movement - 1 year; Source: Innova Asset Management Q224 Quarterly Summary
b. Looking further a field to Emerging Markets (EM)
Chart 4 depicts the price appreciation of 3 indices - S&P 500, Australian 200 Accumulation and the MSCI Emerging Market (EM) Index. All three have moved up, but for EM, most of the gains were since January 2024.

Chart 4: Common base 1 year return to 18 May 2024 on S&P500, 891800NR.MSCI and S&P/ASX200 Accum.; Source: IRESS
c. Is it too late for EM?
Table 1 lists the Price to Book (P/B) ratio (a measure of share price versus book value per share) as at end of April for various indices, taken from MSCI’s individual country Index in USD. Table 1 column B lists in descending order Indices with the highest P/B ratio (most expensive) as at 30 April 2024. Column C compares the P/B of each markets to the EM Index.
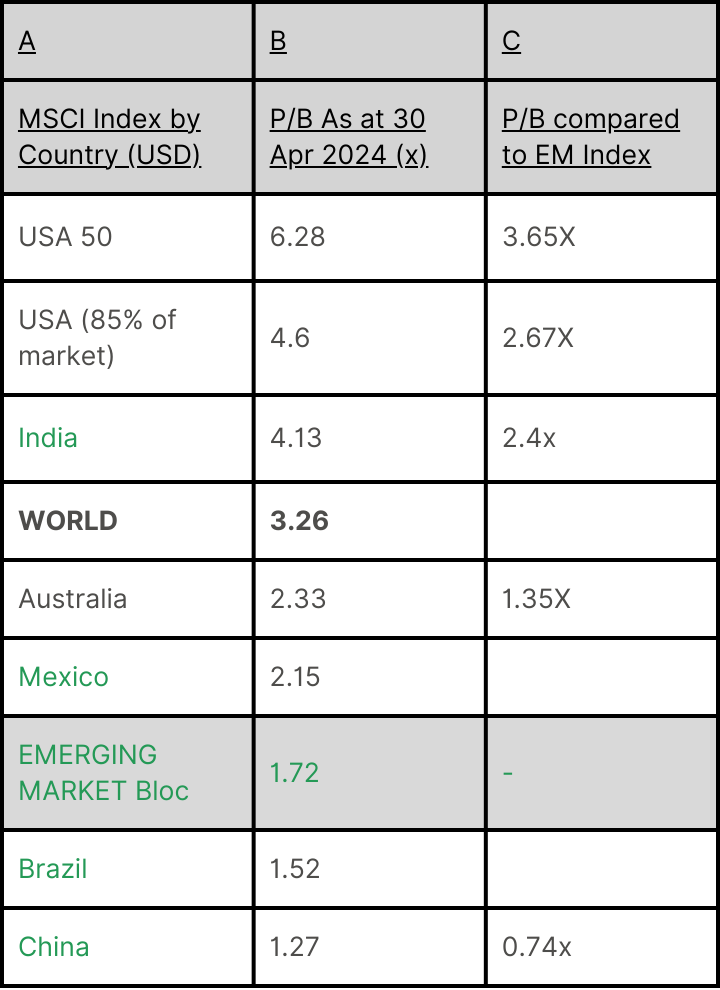
Table 1: Price to Book (P/B) ratio as of 30 April 2024; Source: MSCI
We have the following observations:
- EM bloc’s P/B of 1.72x is low compared to several other indices. Is 1.72x cheap though? Chart 5, shows the Index has been moving closer to its long term average of 1.8x, but is still below (not yet expensive)
- A big divergence between the top US 50 (6.28x) and the rest of the US stocks (4.6x), re-iterating the comment of US large caps being in the expensive territory and the need to diversify for risk management
- A big 3.65x premium in P/B of US 50 compared to P/B of the EM Index, highlighting an opportunity to allocate to lower P/B region
- India (4.13x) is trading at 40% premium to the EM Index (1.72x)
- China is trading at a discount (0.74x) to the EM Index
- The divergence between India and China, though in the same EM bloc in terms of valuation (4.13 vs 1.27) and performance (Chart 6). This is an important distinction to note as countries within EM have different characteristics and own nuances.
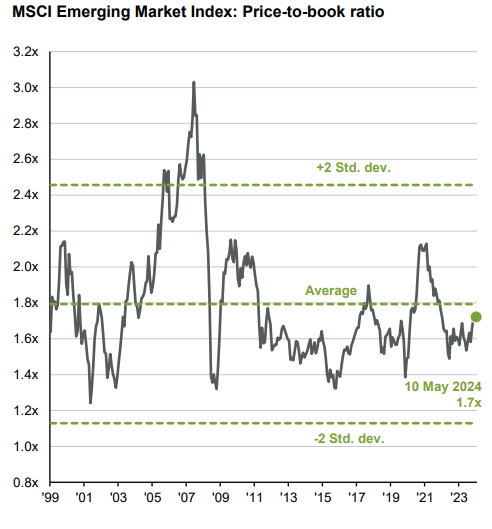
Chart 5: MSCI Emerging Market Index: P/B ratio; Source: FactSet, Standard & Poor’s, J.P. Morgan AM Guide to Markets - Australia. Data as of 10 May 2024.
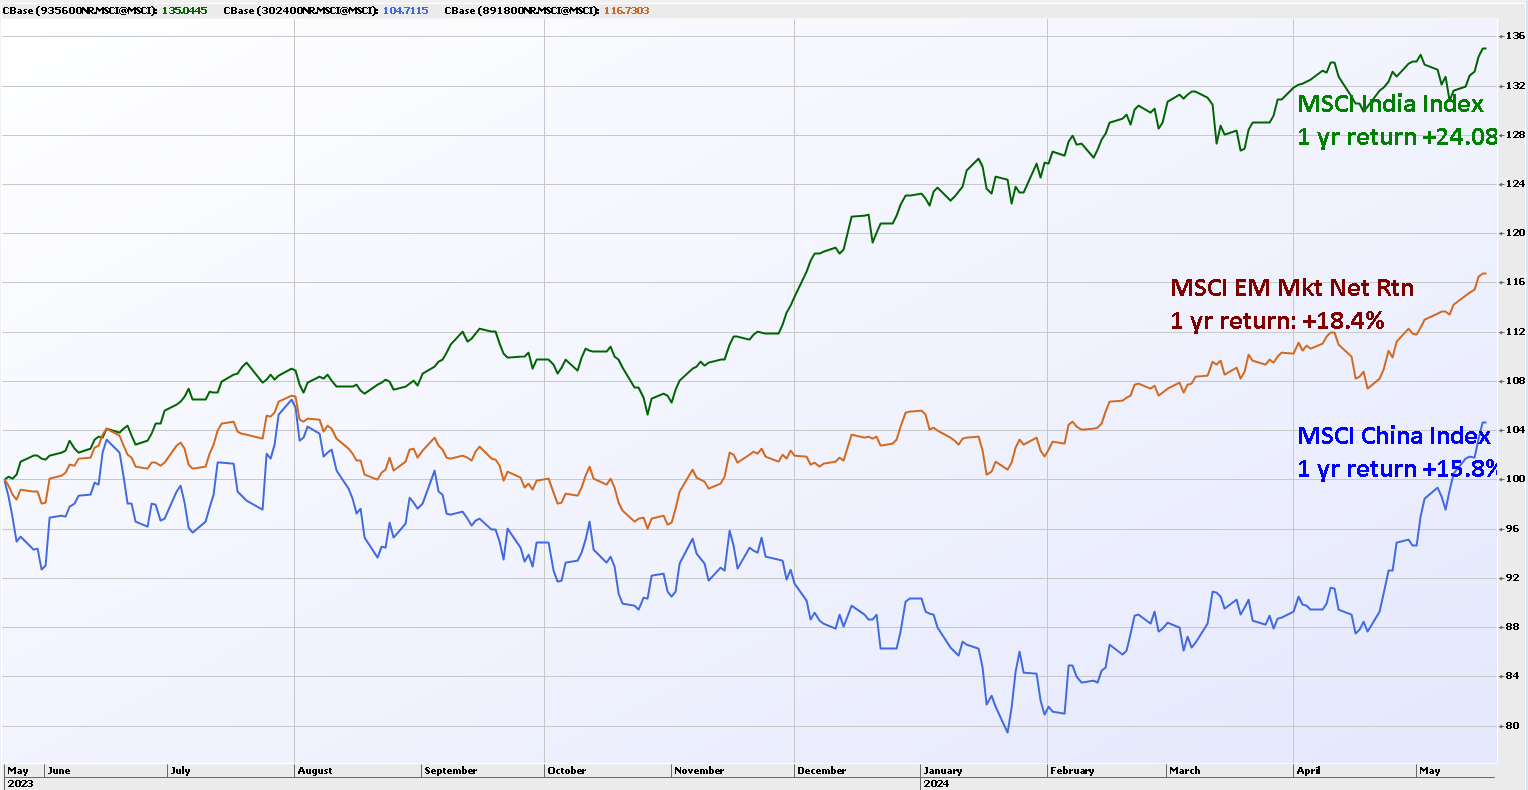
Chart 6: Common base 1 year return to 18 May 2024 on 891800NR, 935600NR, 302400NR.MSCI indices.; Source: IRESS
This unevenness would not surprise readers as we know China had been trying to recover in a deflationary environment (April24 CPI was 0.3% compared to last year) whilst India has been powering on tremendous growth (with inflation at 4.83% with economists’ fear of overheating). The divergence in performance is supported by the expected growth rates of the individual countries. See International Monetary Fund’s (IMF) growth projections for individual countries in the EM bloc in Table 2.
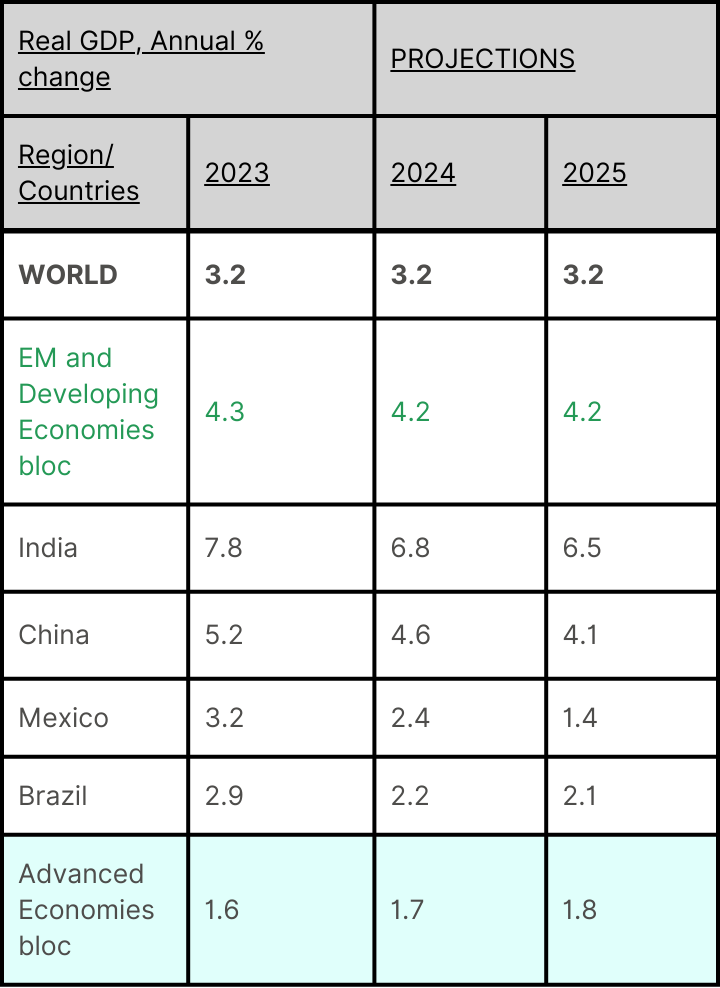
Table 2: World Economic Outlook Growth Projections by IMF, April 2024; Source: IMF, World Economic Outlook, April 2024.
Note: For India, data and forecasts are presented on a fiscal year basis (starting in April 2023 for FY23) with projections on calendar year basis. Advanced Economies include US, Euro area countries, Japan, UK, Canada and Other Advanced Economies (which include Australia).
With Advanced Economies bloc projected to grow by a limp-ish 1% plus and world’s growth rate expected to stay steady at 3.2%, is IMF expecting EM to be doing the heavy lifting in the next couple of years?
Is this too heavy a responsibility on the shoulders of the EM bloc?
Let’s take a closer look at EM.
Dynamics of Emerging Markets
a. EM’s contribution to global GDP
IMF expects EM’s contribution to global GDP to reach 62% by 2029. EM is playing an increasingly significant role in global GDP.
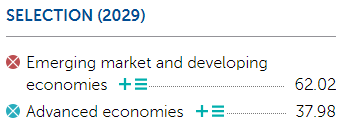
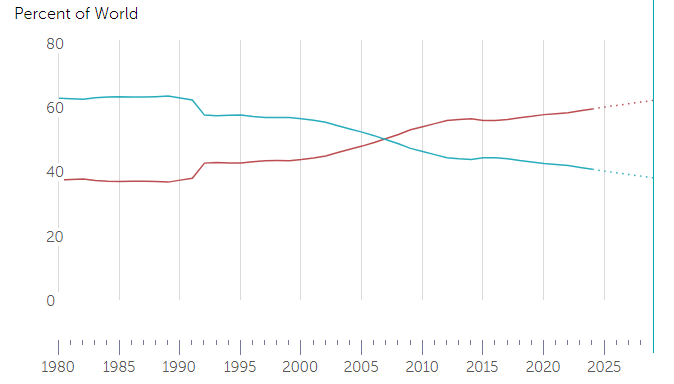
Chart 7: EM’s contribution to global GDP based on PPP, share of world; Source: IMF
b. The spill over effect of EM to global growth
The gradual increase of greater connectivity between Advanced Economies (AE) and EM in the last decade has resulted in greater spill over effect of EM’s GDP growth/set backs on AEs.
note: Advanced Economies include US, Euro area countries, Japan, UK, Canada and Other Advanced Economies (include Australia).
Chart 8 is IMF’s research of EM’s idiosyncratic growth surprises and their effects on AEs. From 2014-2022 (red dots) there had been more positive correlation in EM’s growth to AEs as compared to blue dots which were not, during the 1990s to 2013.
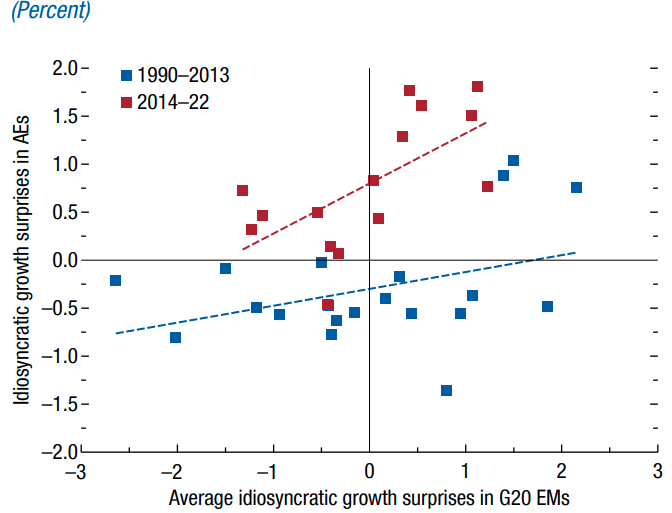
Chart 8: Correlation of idiosyncratic growth surprises between Advanced Economies and Emerging Markets; Source: IMF staff calculations
Note: Growth surprises are defined as GSit = Growth Act – Growth it – 1 (using the April WEO projections); idiosyncratic growth surprises (γit ) are defined as the residual of this regression: GSit = τt + θi + γit , in which τt and θi are year and country fixed effects, respectively. See Figure 4.1 for a list of G20 EMs. AEs = advanced economies; EMs = emerging markets; WEO = World Economic Outlook.
The upside spill over is said to have raised the GDP growth of other developing EMs within the EM bloc by 0.7% during the observation period and a smaller 0.5% in global growth.
This then begs the question of how much any negative impact from EM have on AE’s growth. We are reminded of the oil price spike amid the Russia/Ukraine conflict and the subsequent supply side shock that reverberated around the world. Domestic shocks in EMs can drive large spill overs to the global economy, with productivity and employment implications in various sectors at varying degres due to reallocation of activities.
Each country within the EM bloc contributes and brings different implications to the global value chain. Chart 9 breaks them down by country.

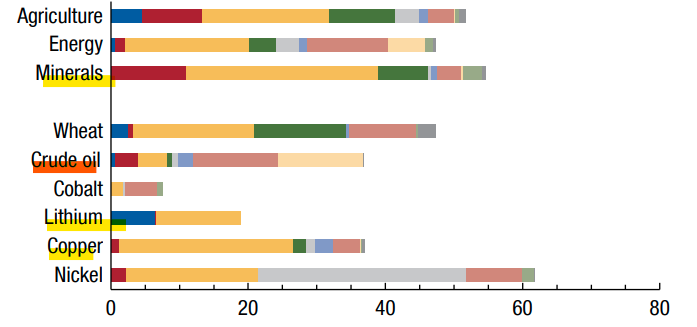
Chart 9: Emerging Market Presence in Global Value Chains and Commodities; Source: British Geological Survey; Eora Global Supply Chain Database; Food and Agriculture Organization of the United Nations; International Energy Agency; US Geological Survey; and IMF staff calculations.
This brings us to reverse spill over effect. One such near term example is the array of tariff hikes unveiled by Joe Biden on China and as the US election draws closer, both the Biden and Trump camps may pile on more tariff hikes. How much may China’s economic recovery be derailed as a result and what about its reverberating effect on rest of developing EM economies? We defer to CMB International for some Asian insight.
According to CMBI’s research, neither the Biden nor Trump’s tariff policies are likely to derail China’s growth recovery ambition. The percentage of China-US trade as a proportion of China’s GDP is so small now that it won’t move the needle. China’s exports to the US accounts for just 0.5% and 0.1% respectively as a percentage of China’s total exports and nominal GDP in 2023. Similarly Chinese imports into US makes up a meagre 0.07% of US GDP in 2023. Tariffs are unlikely to move the economic needle for either but would be a different story when it comes to bi-lateral relationship.
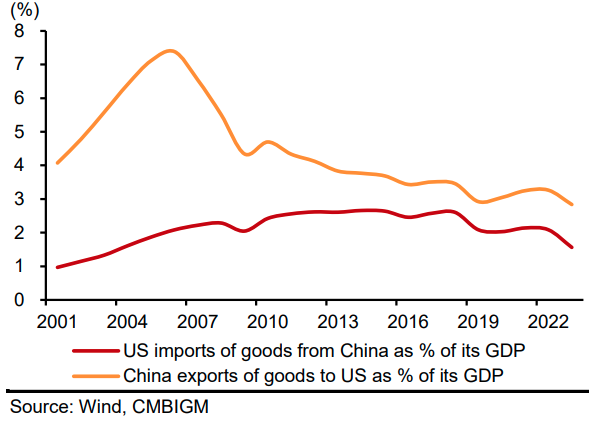
Chart 10: China-US trade as a % of its GDP
c. Economic Size of EM in the world
By 2036, J.P. Morgan projects China to be overtaking US in its economic size, contributing to 34% of global growth, see Chart 11. Then by 2075, India will take over the reign from China, as projected by Goldman Sachs in Chart 12.
So, in the coming decades it’s not just China but India as well, will both overtake US in terms of economic size. EM is going to be the economic power house in several decades and the long term global growth story.

Chart 11: Evolution of China’s economy; Source: J.P. Morgan AM, (Left) BEA, NBS of China; (Right) United Nations, World Bank
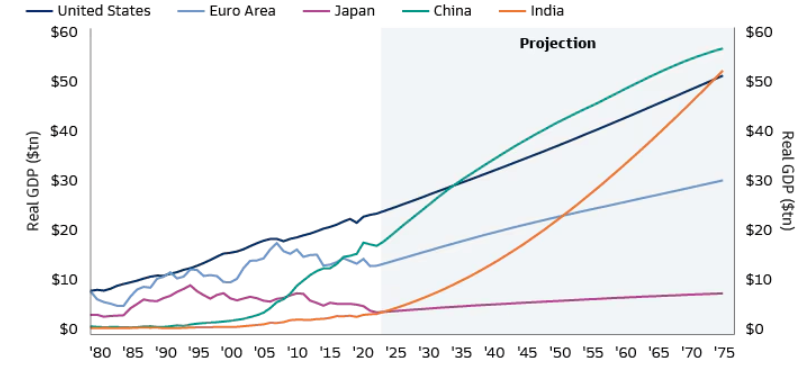
Chart 12: Projection of India’s economy; Source: Goldman Sachs Global Investment Research, as at 12 Feb 2024.
d. Emergence of the middle class in EM
Growing economies bring with them the wealth effect and consumers with purchasing power. Almost 80% of India’s population are expected to be in the middle class by 2030 (Chart 13), with appetites for premium goods and consumer durables and in huge numbers too (Chart 14).
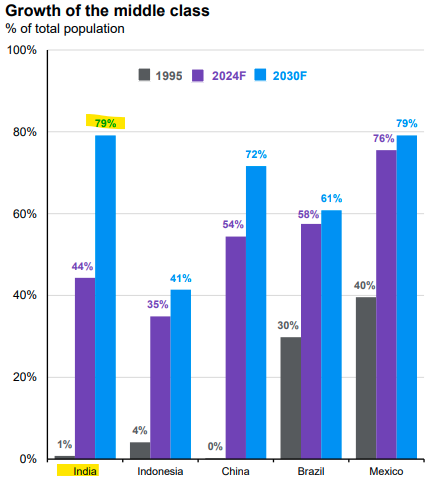
Chart 13: Projection of India’s economy; Source: Brookings Institution, J.P. Morgan Asset Management. Guide to China. Data as of 31 January 2024.
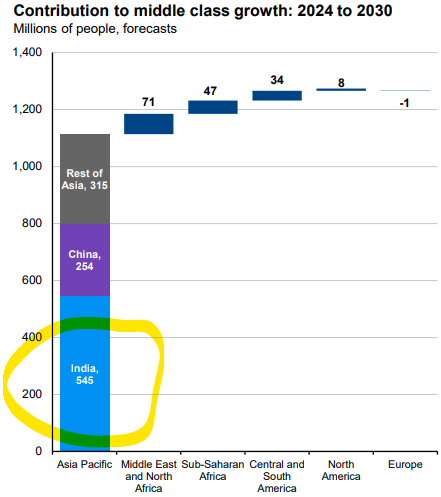
Chart 14: India’s contribution to middle class growth: 2024 to 2030; Source: Brookings Institution, J.P. Morgan Asset Management. Guide to China. Data as of 31 January 2024.
e. A Young Population
Another positive characteristics of the EM countries is their younger population. Especially the most populous country in the world, India. It has the youngest median age in its cohort, sharing the rein with South Africa, with median age of 28.

Chart 15: World population median age by Country; Source: Worldometers, July 23.
Charts 16a and 16b show the change in the shape of India’s population in the next 30 years; bulging at the right age bracket.
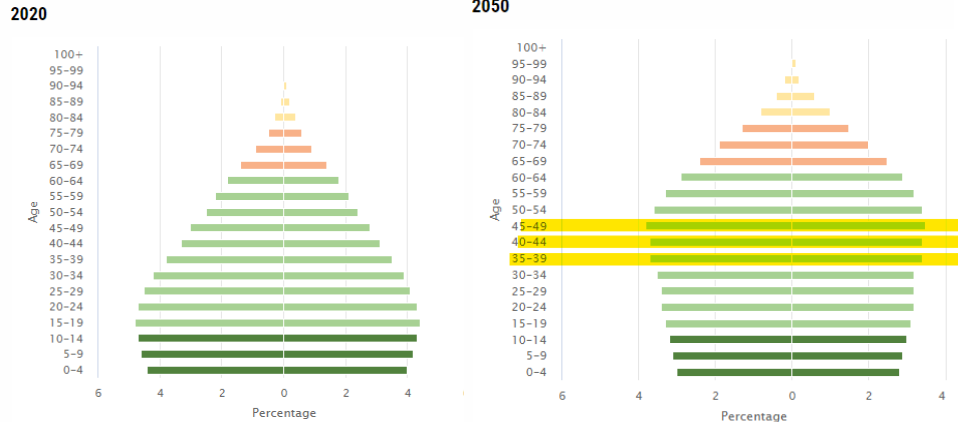
Charts 16a and 16b: India’s projected demographic changes from 2020 to 2050; Source: Economic and Social Commission for Asia and the Pacific (ESCAP), 2022
By 2030, half of India’s population will consist of Millennials and Gen Z who will unleash spending power and a tech-savvy work force (especially in e-commerce, food delivery and fin tech).
Compared with the shape of China’s in 2050 in Chart 17, which demonstrates more of an aging population.
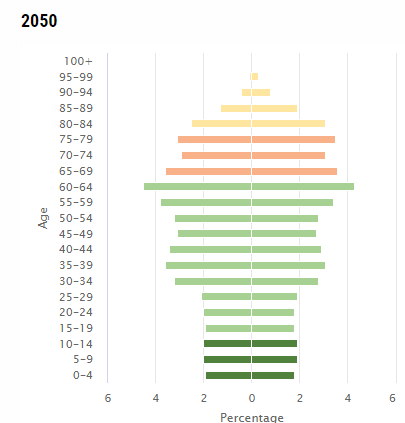
Chart 17: China’s projected demographic changes from 2020 to 2050; Source: Economic and Social Commission for Asia and the Pacific (ESCAP), 2022
As China emerges from economic recovery and change in its population age profile, we will find consumers continue to spend, but differently. Chinese consumers who used to be the buyers of luxury goods and electronics, are now found to be buyers of experiences. We are beginning to see this pattern from the latest retail sales, where spending were focused in travels and EVs (Chart 18).
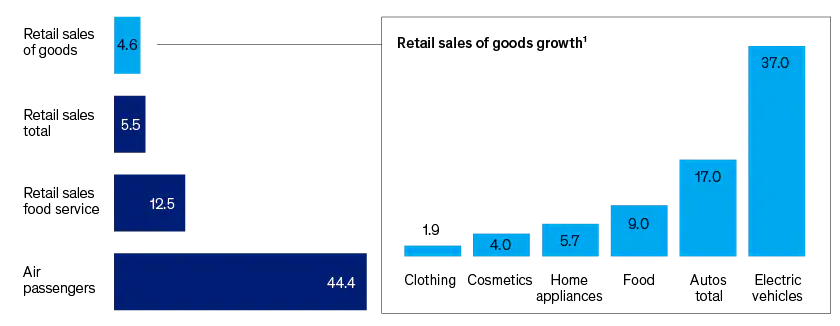
Chart 18: China’s retail sales growth, Jan to Feb 2024, % (y o y); Source: McKinsey & Co. China Automotive Technology and Research Centre; Civil Aviation Admin of China; NBS
f. Growth potential
As India takes on the reign of being the most populous country in the world, see Chart 19 and more of the population in large numbers move into middle class, these bring with them challenges.
Upgrading of infrastructure (rails, airports, ports and roads which are part of the government’s near term election promise), urbanisation and desire for cleaner fuel (for example through EV uptakes), are activities that are expected to place India at a constructive stronger for longer growth phase.
Not forgetting the currently low minimum wage and 1 in five women being in informal work force in India, much reform is still needed and some of these challenges can be turned into opportunities; for example, more females mobilised into the middle income work force.
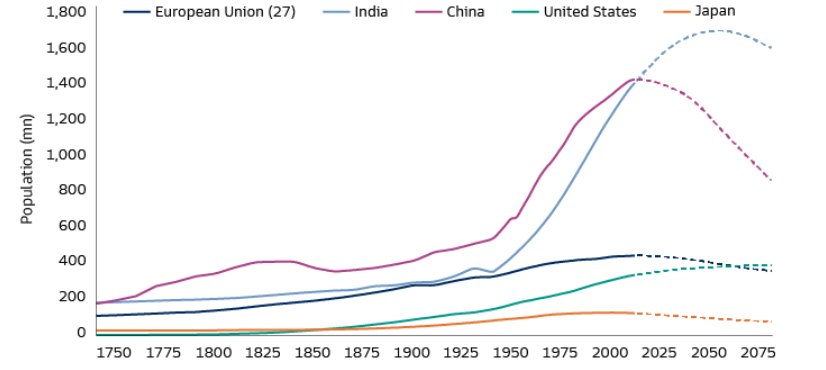
Chart 19: World Population; Source: HYDE (2017), Gapminder (2022), United Nations (2022), Our World in Data, Goldman Sachs Global Investment Research, Strategy Expresso. As of 6 July 2023.
India is currently still at a very low base when it comes to population internet penetration and economic output per head.
Table 3 lists the comparative details of three EM countries’ with Australia as a comparison; from the size of their economies, populations’ internet penetration rate and per head economic output.
We observe the following:
- Despite similar median age of population with South Africa (SA), India’s internet use penetration is only 46% compared to SA’s 76% (opportunity)
- Though SA’s economy is only a fraction (11%) of India’s, SA’s economic output per head is almost 3 times of India’s (refer to comment about workforce above)
These show growth potentials and some remaining low hanging fruits to be harnessed.

Table 3: Growth potential; Source: The World Bank, 2022.
Despite these potentials we are identifying in India, Foreign Direct Investments into China since 2019 still outweigh India (Chart 20).
A change in flow of funds from institutions can be a further boost to the Indian market.
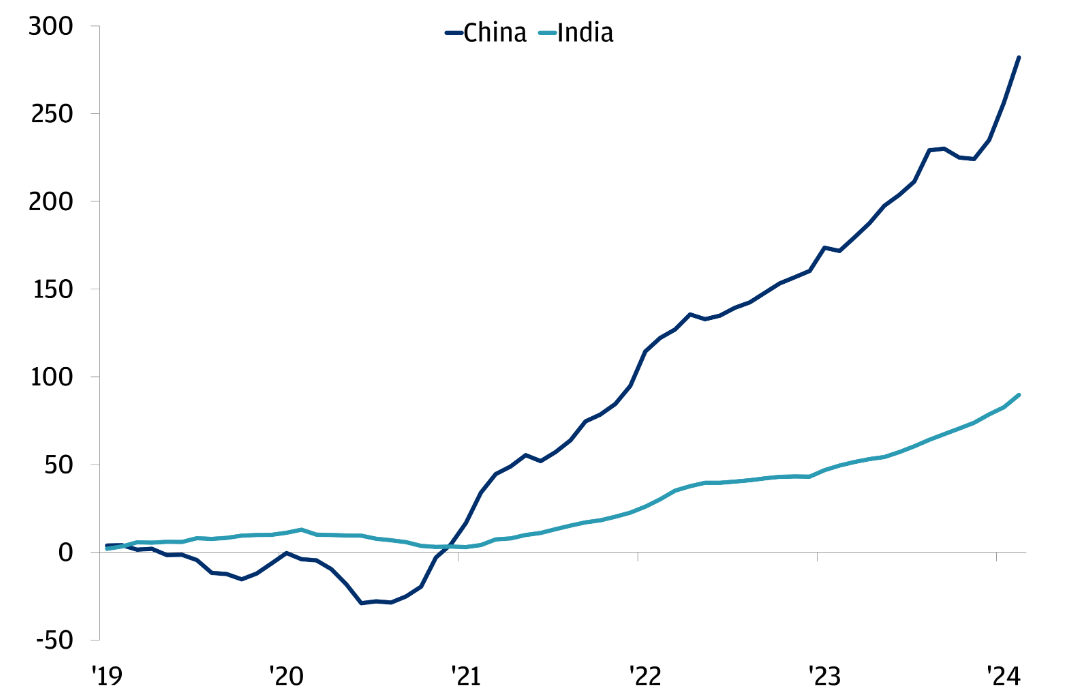
Chart 20: Cumulative equity flows into China since 2019, in USD; Source: EPFR Global, Haver Analytics. Data as of February 2024.
EM vs ROW
In summary, we are observing that EM is no longer cheap, but compared to Rest Of the World (WOR) there is more growth expected from the region.
Investing in EM does bring extra challenges as each of the country within the bloc has different characteristics especially the two countries with the largest weighting in the EM Index, China (25%) and India (18%).
However, long term growth in India is established and the recovery of China is looking better.
As some ROW markets continue to rally towards new highs, the consideration of investing in EM should become easier, as a source of diversification, from high beta and highly priced stocks to stocks with lower valuation.
Investors could access the region via managed funds or ETFs, either EM as a whole, EM ex China, individual countries within the EM bloc or even direct securities on the specific exchanges. Additionally, the percentage weights investors are choosing to allocate to EM or its countries as a percentage to overall portfolio will play an equally important role in determining the portfolio’s potential risks and hoped for rewards.
If this discussion has perked interests, feel free to speak with your Adviser for a strategy and solution that suits you.
Please note: This is not a recommendation to invest in Emerging Markets. This is for information and education purposes only. Please seek professional advice.