New High, How High?

Acuview Jan 2024

Figure 1: Stock Market Movement Scale
If January 2024 was the month when Indices climbed towards their previous all-time highs and slightly more, then February would be the month mindsets were broken and a new psychological level of 7700 breached - on Feb 2nd with a reading of 7703.
Cognitive Biases
Previous highs (and lows) are levels that are often mentioned and tend to have greater significance to Investors. This phenomenon may be explained from the cognitive bias perspective of anchoring, where we have a tendency to place more emphasis on past information or events that have happened in the past. This tendency is enhanced in price charts as they generally form the supports and resistance levels of the underlying, which arguably is an accumulation of investors’ collective anchoring bias. So, when a certain previous high level (like 7632 on the ASX 200 from Aug’21) was first breached on 31 January of this year (to a new high of 7682) there was jubilation. Investors quickly looked to the next possibility, which interestingly evoked yet another cognitive bias, that of round-numbers, the 7700 level on the ASX200.
Let’s test this cognitive bias out. How many times have you found yourself at the petrol pump stopping at an amount that ends with a zero like $50 or $50.01 (because we missed). Psychologists say us humans have an irrational preference for round numbers! Well, the new all-time high for ASX200 currently stands at 7703 (perhaps a miss of the 7700?) reached on Feb 2nd, see Chart 1.
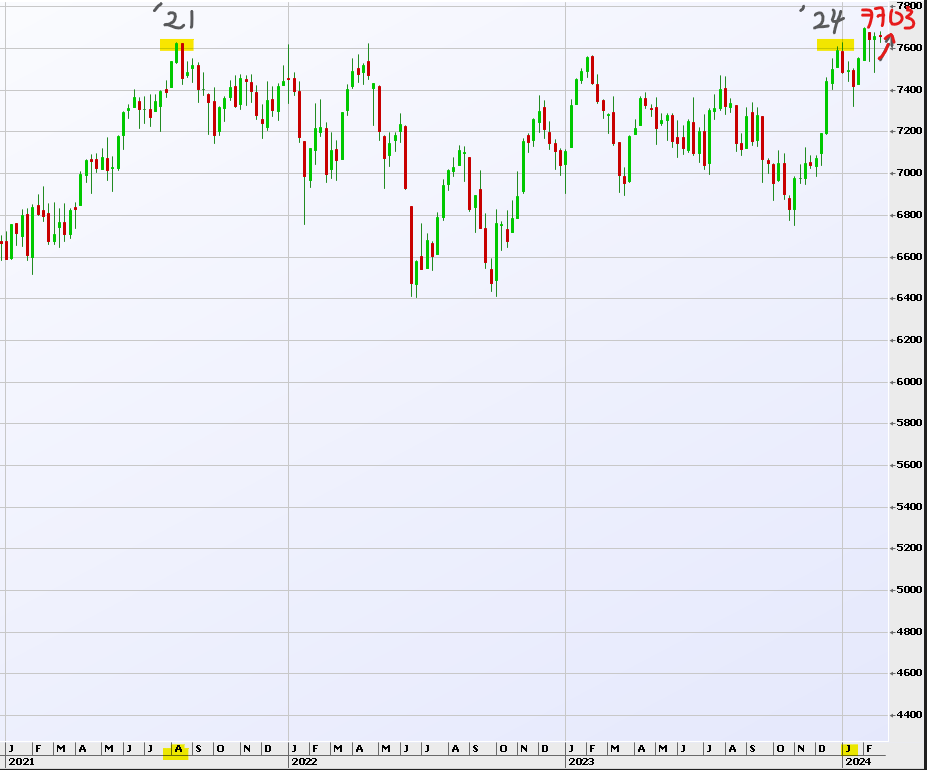
Chart 1: XJO; Source: IRESS
If we pursue the premise that Indices, investment markets and stock prices are primarily driven by humans and their resultant inherent cognitive biases then perhaps we can appreciate the growth of systems based approach to trading or investing money. You may have heard of CTAs (Commodity Trading Advisors), trend following traders, proprietary traders or fund managers who use program trading.
These are basically discretionary trading systems or strategies that are set to execute trades based on pre-set criteria, signals and triggers. Some of the indicators used may be technical/chart signals like the 200-day moving average breakout or momentum like RSI (Relative Strength Index) or signals from economic data like latest release of CPI or GDP numbers. Trading rules are pre-determined by the trader or manager with execution of trades (buy or sell, price ranges or limits and contract sizes) pre-programmed. The underlying instruments of these programs could be anything from futures and foreign exchange contracts to multi-assets like stocks, bonds and currencies.
Big Five
Consider your investment decision of a stock that has just registered a new high. Before any analysis is undertaken, would you, instinctually tend to be more inclined to buy or sell? If we continue on this openness to self-evaluation discussion, an investor who is more characterised by optimistic/extraverted emotionality may intuitively tend to be a buyer versus another who is higher in negative emotionality or conscientiousness may be more inclined to holding back. This is not as much a discussion of investment return as it is about the biases that is inbuilt in any investor’s decision making process and at times, the unconscious factor that influences decisions. This behavioural factor of investors plays a more prominent role at potential pivot points of markets, where cognitive biases tend to come to the fore, a few of which had been discussed above. Are there any more cognitive biases currently at play in your decision making?
Diagram 1 below depicts the five factors of an old theory: developed in 1949, the Big Five sets out to describe the five big dimensions of our personality. Do you know what your more dominant dimension(s) may be? If you would like to find out, our Money Personality Quiz can tell you in 5 minutes, accessible from the top of our homepage.

Diagram 1: The Big Five Personality Traits
Big Four
Apart from our personality traits there are certain emotions that infect investors more; they are regret, fear, greed and indecisiveness; the Big Four emotions.
I propose that one of the hardest decisions in share investment is the cutting of losses. You may hear the derivative of this scenario as, “it is a long term hold”. This is one decision that first aggregates regret (for making the initial wrong decision) then fear and at the same time greed (of losing out when it recovers) which then cause the fourth, indecisiveness.
This is where machines or systems come to the fore. They are pre-programmed to sell automatically when a certain pre-set condition is reached, for example, “Sell 50% when the latest share price is 20% below its purchase price”. At the current climate though, it may be “Buy when hew high is triggered”!
If humans are plagued by cognitive biases, with emotions playing a big role in investment decision making, then studying or gauging the sentiment of other investors could produce useful insights to market sentiment.
Let’s take a look at a survey of fund managers.
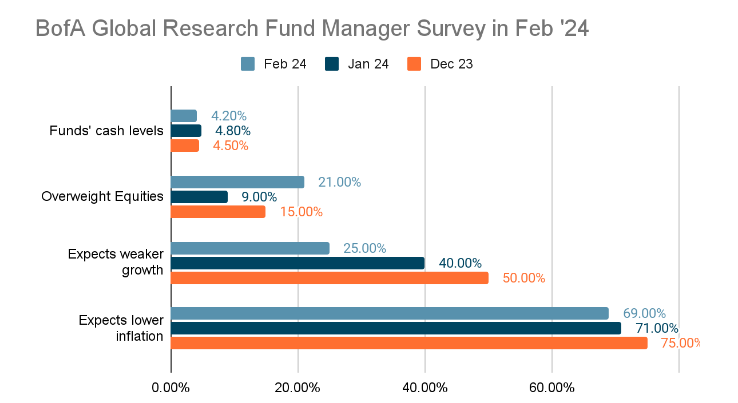
Chart 2: BofA Global Research Fund Manager Survey in Feb24; Source: BofA Global Research
Bank of America Global Research undertakes a monthly survey of about 250 fund managers who manage a combined US$650b. They are asked amongst others, the level of cash their funds were holding in the prior month, weights in Equities and their expectations of growth and inflation in the US.
In the latest early February results (light blue bar in Chart 2) we saw an optimistic bunch. Cash holding reduced (to 4.2%) with more relegated towards equities (21% more than Jan’24). As a group, the managers were also more positive on economic growth and believe inflation to be heading in the right down trend.
Let’s now turn to the AAII Investor Weekly Sentiment Survey for a reading of US individual investors. We have a one week more current data (14 Feb) than the BofA’s monthly reading (on 8 Feb), which is also the week S&P 500 hit a new high, Chart 3.
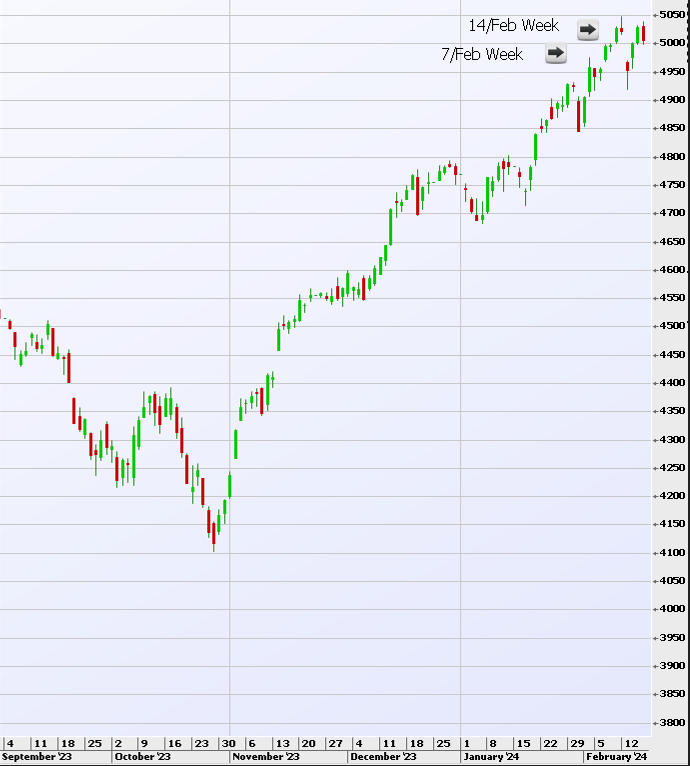
Chart 3: Latest performance of the S&P 500 Index; Source: IRESS
See Chart 4 for the result. In the latest week (light blue), investors are still feeling bullish, but 7% less of them with 4.2% of the crowd having moved down to being bearish and 2.5% feeling neutral.
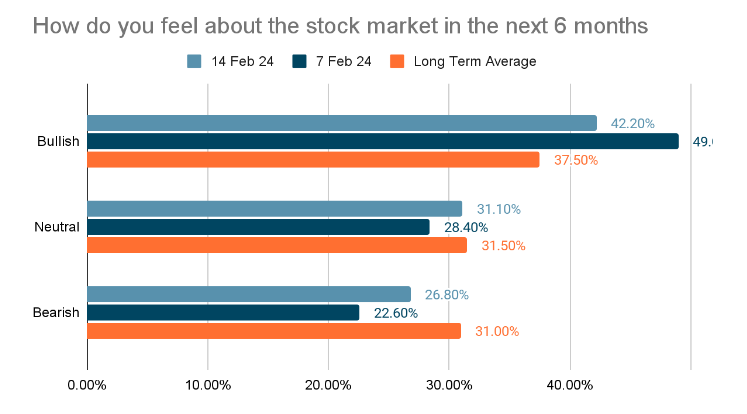
Chart 4: AAII Members Sentiment; Source: https://www.aaii.com/sentimentsurvey
Coming back to the BofA Global Research Survey, it is widely watched for two interesting signals. The first is the quantum of increase or reduction in cash levels, with 0.5% being the threshold. From the past, for example, a 0.5% reduction in cash holdings in a month has found to be a signal for equities to be rising for the next 3 months by about 4%. In Feb’24, cash levels dropped by 0.55% (see Chart 2). The next signal watched is the 4% cash level which acts as a trigger point for the Sell button (acting as a contrarian signal). The Feb’24 cash level is only 0.2% away. Chart 5 is a history of this measure.
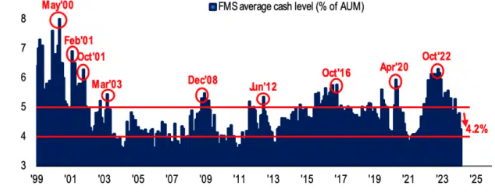
Chart 5: History of BofA Global Research Survey; Source: BofA Global Research
What do the Facts Say?
There is another data point that we watch to keep track of fund managers’ potential change in sentiment. Their derivatives strategies through activities in the options market, especially the number of put option contracts traded over Indices (as put options rise in value with the fall in price of its underlying instrument), these strategies act as downside hedges or bearish trades. Chart 6 below from MacroMicro succinctly depicts the current sentiment.
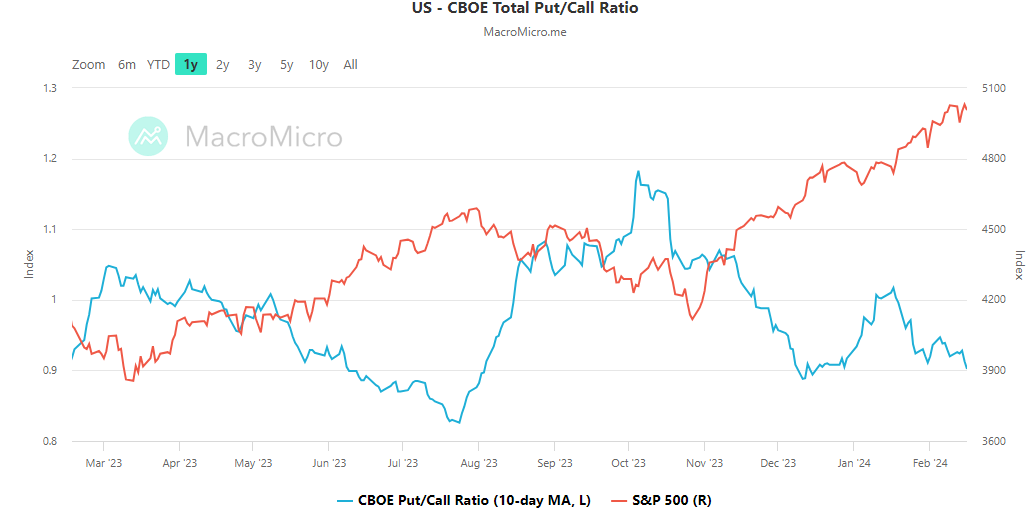
Chart 6: US CBOE Total Put/Call Ratio; Source: https://en.macromicro.me/collections/34/us-stock-relative/449/us-cboe-options-put-call-ratio
You will see from Chart 6 that as the red line (S&P 500) climbed, the number of puts traded over calls (blue line) has been decreasing. The ratio shows either the number of puts bought for hedging or bearish strategies had been reducing or buying of call strategies for bullish view had been increasing. The falling blue line indicates a more positive stance of positions taken.
Let’s take a look at our very own S&P/ASX200 (XJO).
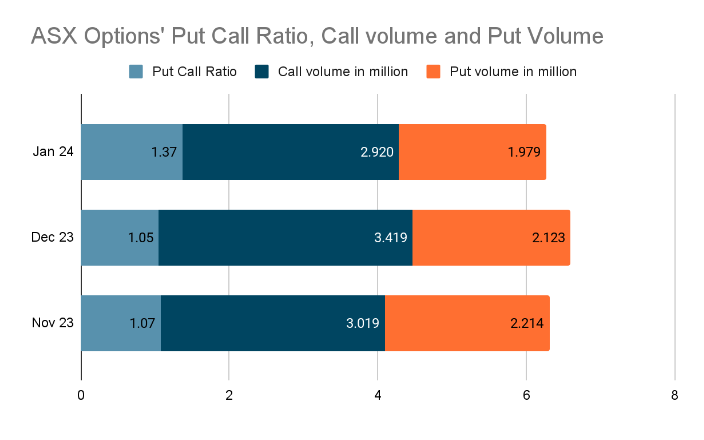
Chart 7: ASX Put Call Ratio on options and call and put volume traded; Source: ASX
Chart 7 shows the volume traded in January was lower despite the Index rising a smallish 1.2%, though this is likely to be more a reflection of the holiday season. What’s of note though from January are the following:
- The index put call ratio climbed to 1.37 (light blue) over steady volume on Index options (less bullish)
- of the calls traded, large volume were over the banks (a reflection of bank shares that have been rising since December) and possibly less of an overall market bullishness. Chart 8
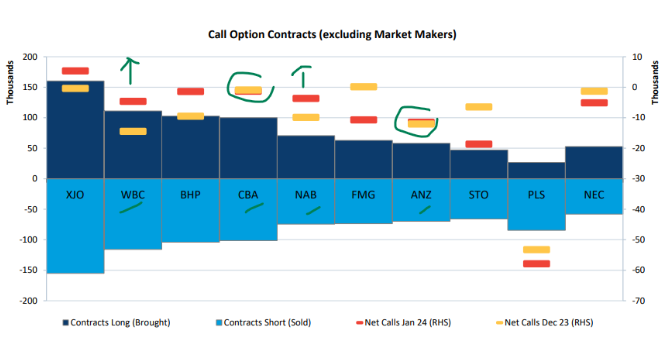
Chart 8: Top 10 calls traded in January 2024; Source: ASX
Chart 9 below shows quite a similar picture to that of the US where, as the S&P/ASX 200 climbed (dark blue line), net bearish strategies (light blue bar) had been falling.

Chart 9: ASX Options Net Buy/Sell Volume; Source: ASX
Let’s now take a look at fundamentals.
On 9 Feb 2024, the S&P/ASX 200 was trading at 1 standard deviation (68% away) from its mean (which is about 14), with the forward PE ratio sitting at 16.4x on Chart 10. On this measure, the Australian market is not cheap.
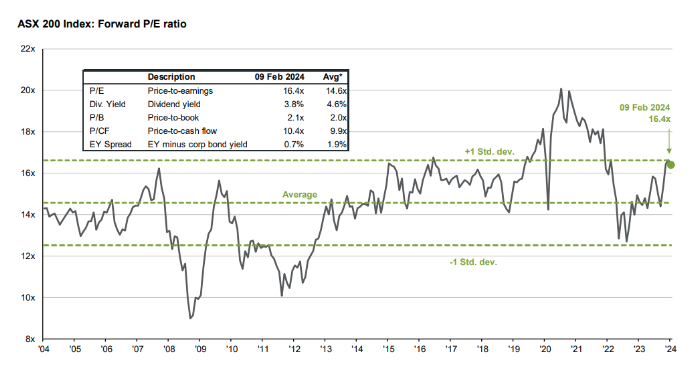
Chart 10: ASX200 Forward PE ratio; Source: Guide to the Markets – Australia. Data as of 09/02/24.
In terms of economic data, Australia’s inflation seems to have some way to fall before reaching RBA’s target but currently though, it is in the right direction, which is downtrend. Chart 11.
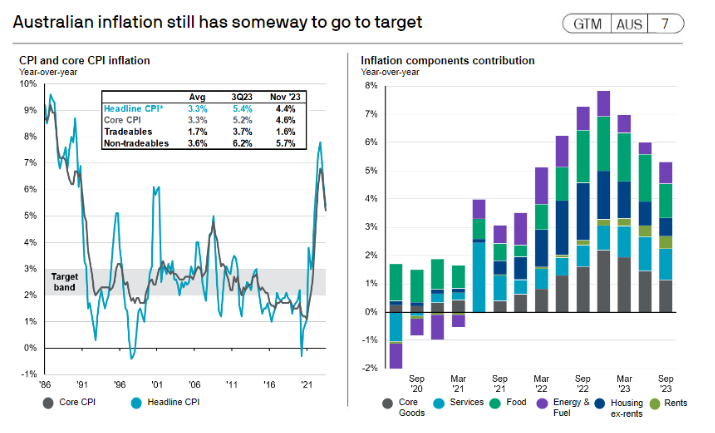
Chart 11: Australia Inflation; Source: JP Morgan ABS, Factset
What about economic growth, is Australia lucky again? Chart 12 displays JP Morgan’s GDP forecasts for several major regions. Australia’s forecasted growth though smaller than 2023 but is still acceptable with an expected low risk of recession.
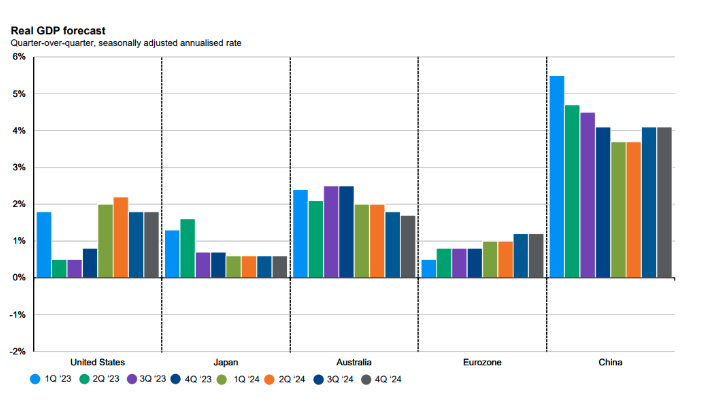
Chart 12: Real GDP forecast; Source: JP Morgan Guide to Market 09 Feb 2024
Macrobond expects Australia to again likely to escape recession, with its recession pressure gauge (derived from a list of economic indicators) at a low 43%.
The US economic forecast though, is a little more divided and wide. Some forecasters have increased their expectations after an improved 2023 GDP growth. For example, Goldman Sachs has just (February 20th) increased its GDP expectation to 2.4% due to stronger consumer spending and residential investment. For other economists, majority are peppered around the 1.2% to 1.6% range with some just under 2%. Goldman’s one of the more optimistic ones which is translating to a S&P 500's year end target of 5,200. The most bullish though is currently Yardeni Research (in January) with a Target of 5,400. The SP&P500's all-time high thus far is 5048 (reached on February 12th).
What about the risk of recession in the US, with many economists now expecting a soft landing? Well, there are dissenters and a couple of new ones too. Citi’s US Chief Economist has recently changed his view in calling the US economy running into a recession in mid 2024 and Macrobond has also revised up US’ recession pressure to 71% (compared to Australia’s 43% and its December’s number of 60%). The gauge was put up after the recent Federal Reserve Chair Powell’s downplaying of rate-cut prospects and the yield curve has continued to stay inverted (a typical signal of a recessionary economy).
Where do all these gauges and indicators place us?
As indices reach pivot points, in this case the making of new highs, they could either be resistance points or new supports of yet higher levels. Investor psychology and awareness of ones’ (and even the collectives’) tendencies and cognitive biases are important considerations in preventing unnecessary decision errors.
In terms of overall market pulse, you may draw your own conclusion from our discussions above but it appears the overall mood is sanguine, with a tinge of cautiousness. Bearish strategies seem to be still in hiding at the of writing.


