The Moving, Moving Parts

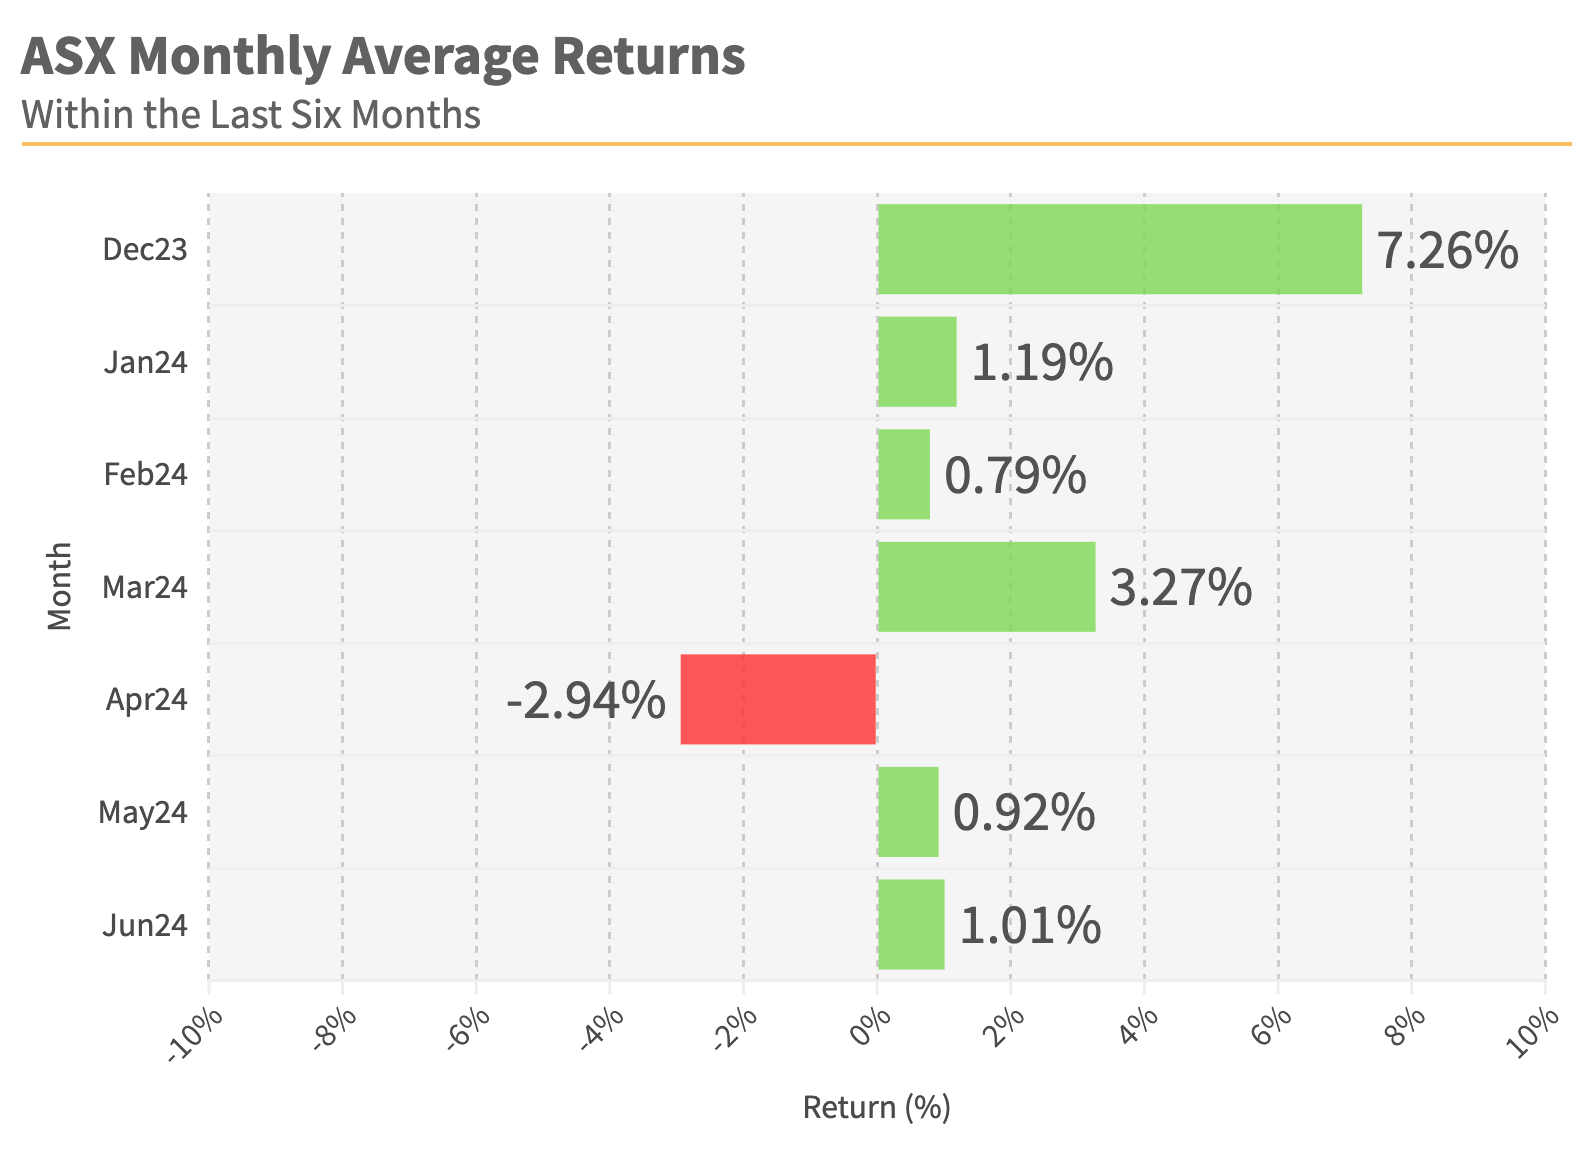 Chart 1: ASX Monthly Average Returns, June 2024
AcuView Jun24
By the end of June, as the financial year concluded, the Australian stock market saw a 12% increase (dividends included). During this same period, the S&P 500 has maintained a robust growth of 21.5%. As investors move towards second half of the financial year, the moving parts of the markets are moving again.
Interest Rate Watch
a. Cooled Inflation in the U.S.
Australia encountered a setback as inflation rose in the latest release, whereas the US saw a decrease in inflation. The most recent inflation rate in the US (for all items) has dropped to 3%, marking the first monthly decline since May 2020, Chart 2.
- Market rallied at the back of this benign number and cheered by the gradual decline in the sticky shelter (rent) component of inflation.
- Whilst food prices was a non-event, medical care has attracted price increases (red line in Chart 2)
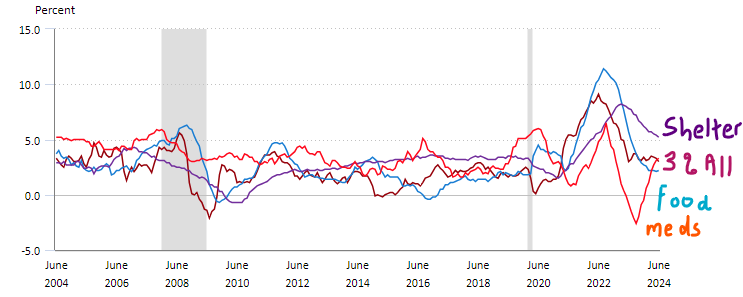
Chart 2: 12-month percentage change, U.S. Consumer Price Index; Source: U.S. Bureau of Labor Statistics
Note: Shaded area represents recessions, as determined by the National Bureau of Economic Research
b. Softer labour market
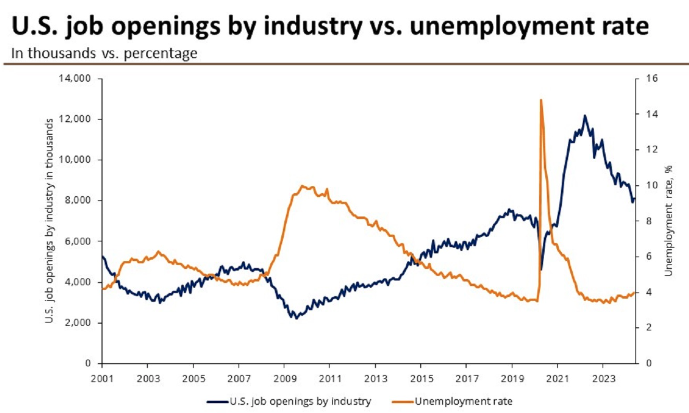
Chart 3: U.S. job openings vs unemployment rate; Source: U.S. Bureau of Labor Statistics, JP Morgan. Data as of July 5, 2024
In Chart 3, the declining black line illustrates the ongoing decrease in US job openings, with the number of available jobs hitting a three-year low. This shift indicates a cooling trend in the US labor market, previously a driver of high inflation.
Simultaneously, the rising brown line in Chart 3 represents the increasing unemployment rate, highlighting that there are currently 1.24 unfilled positions for every job seeker. This ratio mirrors the pre-pandemic levels of 2019, suggesting a balanced US job market where wage increases are unlikely to fuel inflation pressures.
c. FOMC dot plot
In its latest 3 monthly update in June 2024 (blue dots in Chart 4), The Federal Reserve’s dot plot signals one rate cut of 25bp in 2024. This is down from a median estimate of 3 cuts from its March 2024 dot plot (in brown). Dot plot is the the interest rate expectation of the Federal Open Market Committee’s 19 members’ (one each dot) individual assessment.

Chart 4: Summary of Economic Projections; Source: Federal Reserve, March 20, 2024 (brown) and June 12, 2024 (blue)
Note: Each shaded circle indicates the value (rounded to the nearest 1/8 percentage point) of an individual participant’s judgment of the midpoint of the appropriate target range for the federal funds rate or the appropriate target level for the federal funds rate at the end of the specified calendar year or over the longer run.
d. Interest rate Tracker
Since the cooler inflation and softer labor market were reported in early July, and following the June dot plot release, there is now a more optimistic view regarding a possible rate cut. The anticipated rate cut, with higher likelihood, has been moved up to September 2024. This shift is evident in the Probability Tracker in Charts 5a-c based on the Secured Overnight Financing Rate (SOFR) from the Federal Reserve Bank of New York. The SOFR, utilised for pricing overnight loans in the repo market with Treasury Securities as collateral, serves as an indicator of the cash rate.
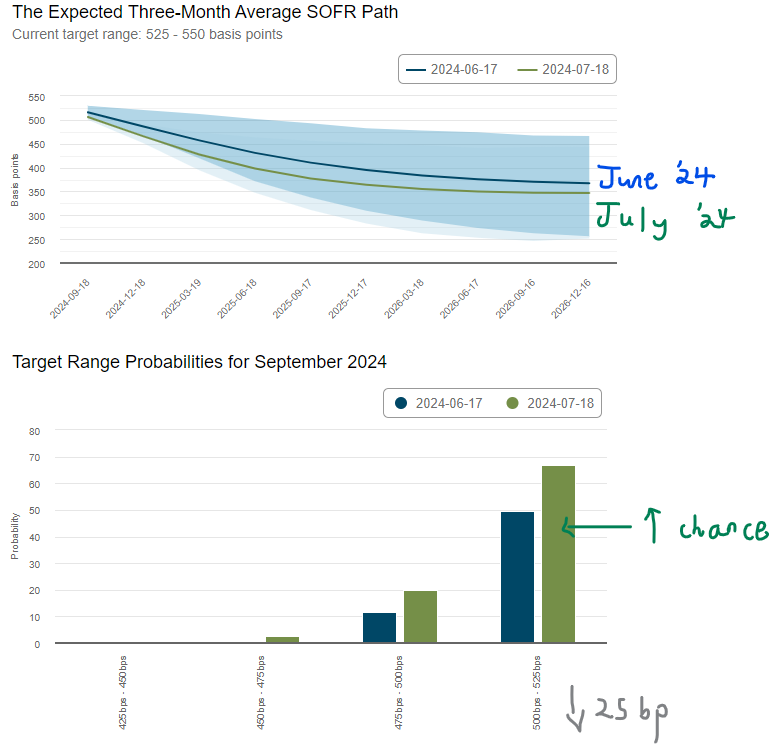
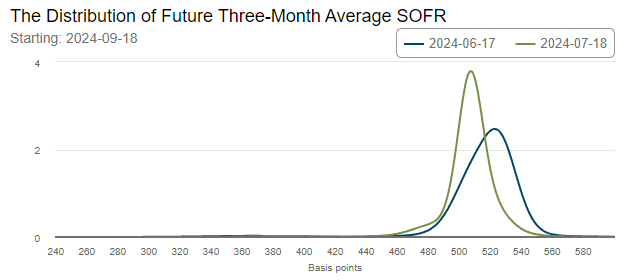
Charts 5a-c: Market Probability Tracker, data dated July 20, 2024.; Source: Federal Reserve Bank of Atlanta
The interest rate glide path is likely to be made more complex with the upcoming election, with each administration’s policies having different implication on inflation, US dollar and interest rate.
Furthermore, Trump has suggested that if he becomes president, he would replace the current FOMC Chairman, Jerome Powell, to combat inflation. This proposed shift in the FOMC's structure could impact interest rates. The possibility of a President replacing a Federal Reserve Chairman is unprecedented, and the full implications are still uncertain.
Election Watch
a. U.S. national debt balance
National debt in the US has ballooned from 57% of its GDP in 2000 to the current 122.43%. With the current balance of $34.9 trillion (Chart 6), the cost of servicing this debt is a behemoth $897 billion a year (the forth largest item on the budget behind defence from the latest US Debt Clock). Looking at it from the perspective of each individual citizen, there is a debt of $103,679 in contrast to a tax revenue of $14,729 per citizen (shortfall).
If the current laws remain unchanged, it is projected that the national debt will reach $50 trillion by 2034.
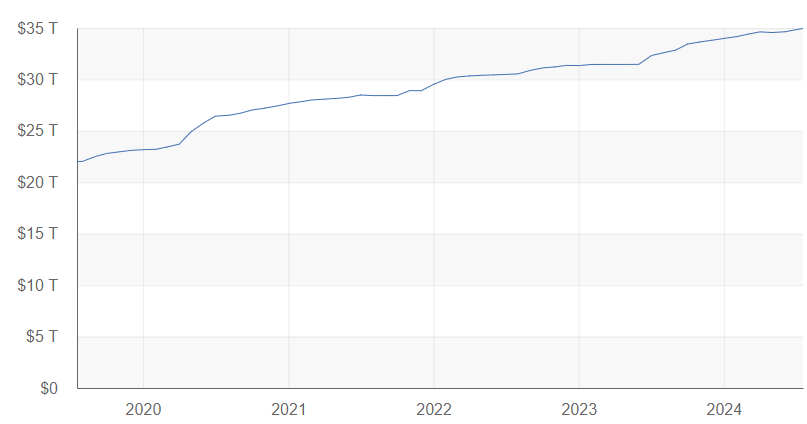
Chart 6: Debt to the Penny, dated July 20, 2024.; Source: FiscalDateaTreausry.gov
The incoming candidate (and their policies) will have a great impact on the level of its national debt.
b. U.S. Budget deficits
The government projects to run an annual budget deficit (that is fiscal spending exceeding its revenue) of $1 trillion a year over the next ten years. The deficit in FY 2024 (ending on 30 Sep 2024) is projected to be $1.9 billion (compared to $1.7 billion in FY 2023). The U.S. has only experienced 4 times of budget surplus in the last 50 years, most recently in 2001.
The country’s high interest bill plus funding of its yearly budget deficits requires the government to borrow even more by issuing Treasury notes. The effect of more Treasury bonds is lower yield in the long term, steepening the yield curve (low in the short term due to expected rate cuts and then trending back up due to these issuance).
No matter who wins the election, there is work to be done, and their policies will play a crucial role in managing the debt and deficits.
c. Policy Watch
Trump's ongoing campaign appears to mirror past strategies with an emphasis on raised tariffs and proposed tax cuts.
During President Trump's last full term, $8.4 trillion was authorised for new ten-year borrowing, whereas President Biden has approved a lesser $4.3 trillion in his 3 years and 5 months in office. A second term Trump Administration is likely to further increase the burden of national debt.
In Trump’s first term:
- President Trump approved $2 trillion in net tax cuts compared to President Biden's $0 debt increase (excluding COVID-related)
- Public debt increased by $7.2 trillion under President Trump compared to the current $6.0 trillion under President Biden
- President Trump achieved a $443 billion debt reduction compared to Biden’s $1.881 trillion reduction ($1.5 trillion from Fiscal Responsibility Act + $252 billion from The Inflation Reduction Act + $129 billion in Deficit-reducing executive actions)
If re-elected for a second term as president, Trump intends to implement a 60 percent tariff on all Chinese products and a 10 percent universal tariff on all imports into the US. The country presently collects $71.3 billion from tariff duties. The newly suggested tariffs are designed to produce $3 trillion over a decade, offsetting projected revenue decreases from personal income tax, which currently brings in $2.3 trillion (47% of US Federal tax revenue), and corporate tax revenue from the existing 21% rate yielding $478 billion (9.6%) to a lowered 15% corporate tax rate.
c.i) Tariff and Efficiency Loss
Economists debate that tariffs serve as a regressive method of revenue generation. This is because they lead to an "efficiency loss" caused by increased prices on goods (due to tariffs) and resultant reduction in consumer demand due to unaffordability of higher prices.
Here is a brief overview of how tariff imposition leads to "efficiency loss."
1. Prices of domestic production and goods consumed at Equilibrium
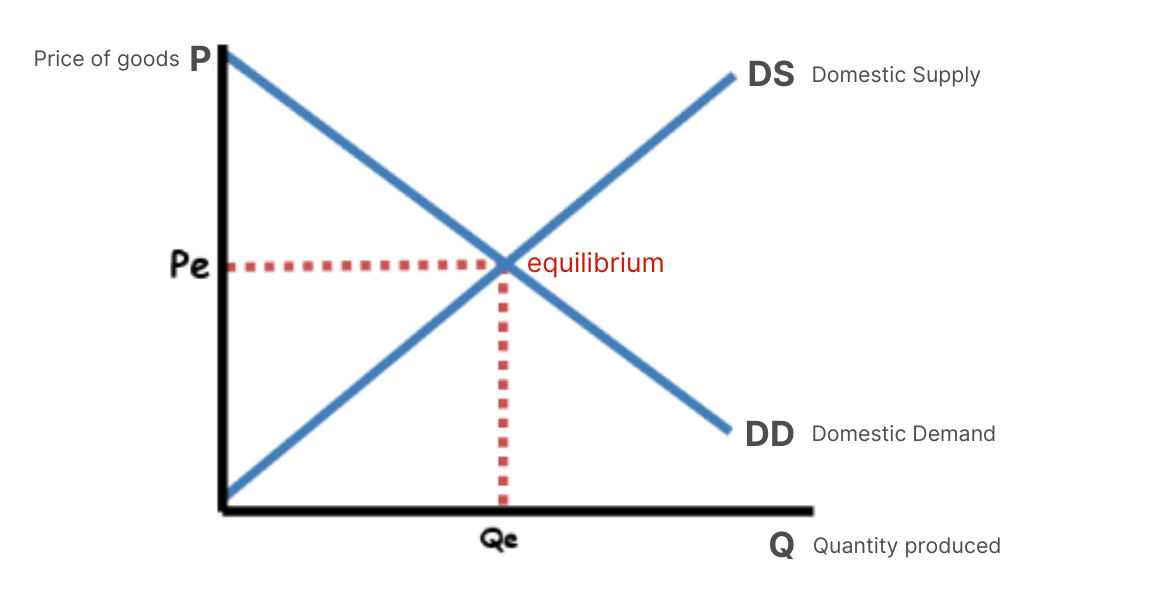
Chart 7: Domestic Supply and Demand in Equilibrium; Source: ReviewEcon.com, Updated March 22, 2024
2. Economic surplus from cheaper imported goods

Chart 8: World price affecting domestic market ; Source: ReviewEcon.com, Updated March 22, 2024
Due to lower imported prices, both domestic consumption and production increases, lifting the economy.
3. Tariff imposition and Efficiency loss
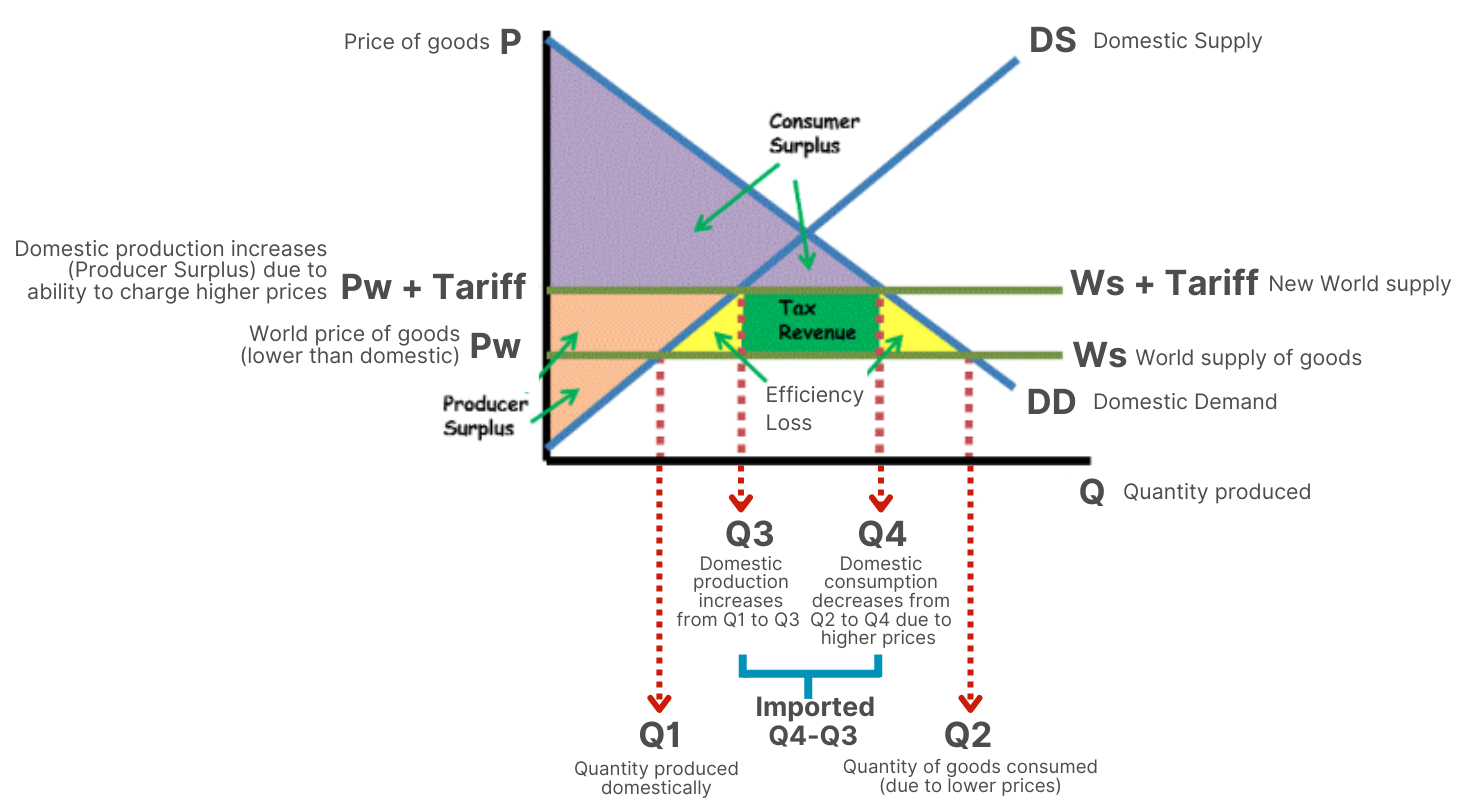
Chart 9: Tariff impacting efficiency; Source: ReviewEcon.com, Updated March 22, 2024
c.ii) Tariff and cost to US household
During Trump’s first tenure, where tariff was increased by roughly $80 billion, it was found to have cost US household substantially. The Congressional Budget Office estimated the cost in 2020 to have been $1,300 per household.
The Centre for American Progress estimates the current 10% tariff on all imports to act like a consumption tax of around $1,500 per household. Based on the current median household income of $39,618 per annum (from Social Security Administration), this is a 3.7% reduction in income or increase in cost for majority of American households and disproportionately worse for low-income Americans. The top 1 percent income earners would be 1.4% better off after tax post tariffs (as they consume less of percentage earnings).

Chart 10: Net distribution effect of Tax Cuts and Jobs Act extensions and tariff increases, % in after tax income; Source: Kimberly A., Clausing and Mary E. Loverly’s policy brief, PIIE dated May 20, 2024
Another study by the National Taxpayers Union estimated that should producers fully pass on these costs to consumers, then it would be $2,600 per household per year.
c.iii) Tariff and Trading partners
The bulk of the 10% import tariffs is expected to impact the US' main Import Partners significantly, with the top 10 accounting for 69% of total US imports. Among these, Mexico, China, and Canada bare the brunt of the tariffs (columns A and B of Table 1).
Precedent indicates that tariff hikes have led trading partners to retaliate. Columns C and D in Table 1 demonstrate the added expenses for households resulting from retaliatory actions by trading partners in response to a 10% tariff.
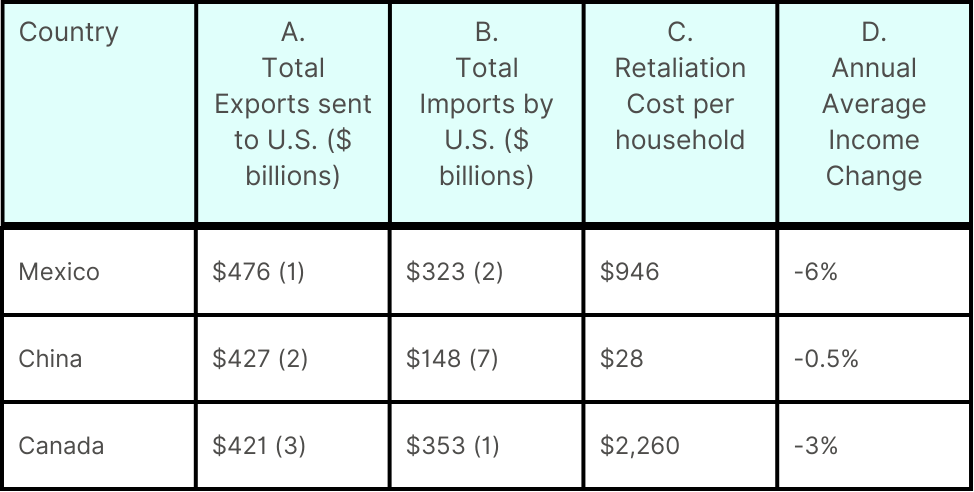
Table 1: US Top 10 Import and Export Partners and Costs to households; Source: American Action Forum, Trump’s 10 Percent Tariffs, Dated June 25, 2024
A proposed 60% tariff on imports from China would increase US tariff value from $300 billion to $522 billion. This tariff hike, including the retaliatory costs from China is expected to impact not just American households but Chinese as well, reducing household incomes by approximately 3% annually, amounting to $1,950 and $170 respectively (additional to those at Table 1).
Moreover, these costs are projected to diminish half of US producers’ surplus value (Chart 8) due to increased tariffs.
a.iv) Tariff and inflation
Tariffs, which are a form of consumption tax, result in higher costs for imported goods, impacting both final products and input expenses.
A recent study by Moody’s Analytics (Zandi, 20 June 2024) indicates that the proposed tariffs could raise inflation by 75 basis points above the current baseline.
Opposing viewpoints propose that tariffs could lead to an initial inflation surge upon implementation, which may later stabilise back to normal, indicating a temporary rather than a lasting escalation. This is because inflation reflects the rate of change, not solely the surge in price levels. Using the current situation as a reference, inflation has started to decline even with the continuous increase in product prices.
The impact of tariff on inflation and its influence on interest rate outlook will depend on the Fed’s reaction to those price spikes, introducing an additional factor to consider in our interest rate watch.
Investing in an election year
The upcoming election with the increasing probability of a second term Trump Administration, is increasing uncertainty for investors. We shall evaluate the impact of election and a potential Trump win on the stock market.
a. Volatility
Below are a set of charts sourced form Centre for Economic Policy Research (CEPR) with a July 1 2024 observation date.
Using VIX as a measure of implied volatility of the S&P500, we observe the following:
- election risk has emerged earlier, since Mar’24 for this election year compared to the previous Obama-Romney and Clinton-Trump era which only started around August
- a fall in volatility is expected after the election in November
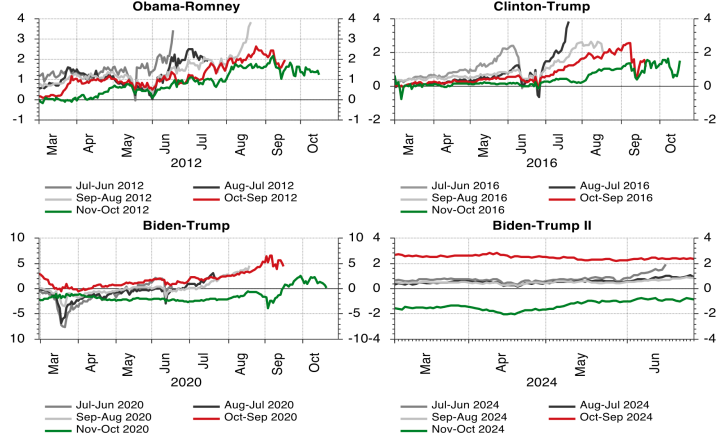
Chart 11: Implied volatility in equity markets (%) compared across electoral years; Source: Rifinitive, CEPR, July 1 2024
Increased implied volatility in foreign exchange is seen across three currencies compared to the USD, with the RMB showing the most significant change. The current USD/CNY rate in Chart 13 indicates that the RMB is still above the lowest rate of 7.3498 recorded on Sep 8, 2023. The surge in foreign exchange volatility has been noticeable since mid-April, likely due to proposed tariff changes.
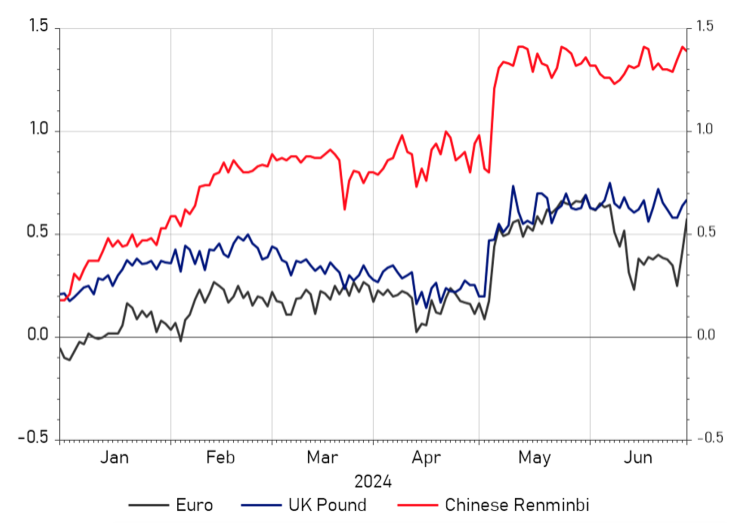
Chart 12: Implied volatility in currency markets (%) ; Source: Rifinitive, CEPR, July 1 2024
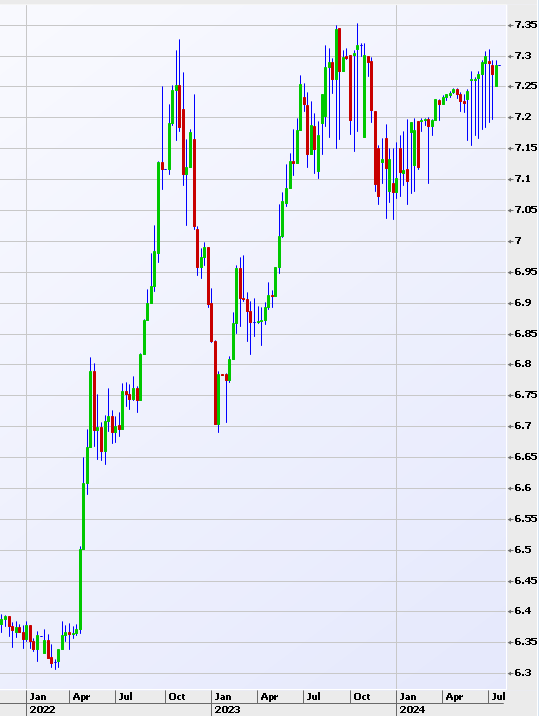
Chart 13: USD/CNY 19 Jul 2024; Source: IRESS
b. Commodity
Under a Trump Administration, short-term oil and gas prices are expected to decrease due to the encouragement of domestic drilling and mining companies. This reflects the administration's preference for fossil fuels over renewable energy sources.
Conversely, a Biden Administration is likely to push for stricter environmental regulations, benefiting companies involved in renewable energy and electric vehicles.
c. General markets and economy
Summary of beneficiaries (by sector) within both administrations:
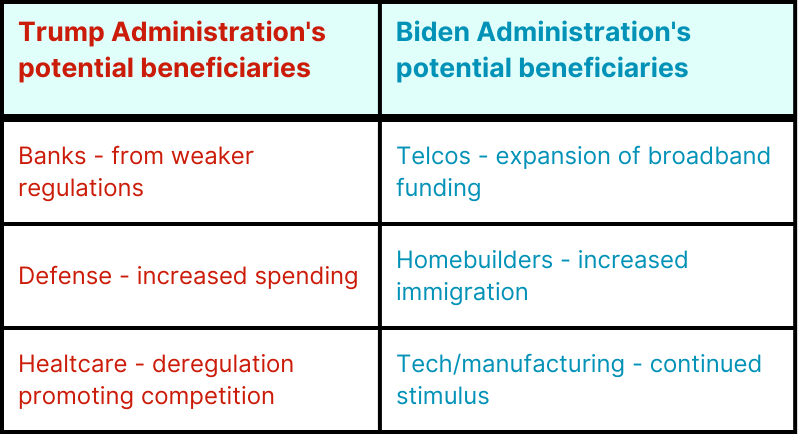
Table 2: Summary of beneficiaries (by sector) within both administrations
d. Stock market
A study conducted by US Bank investment strategists, analysing data dating back to 1948, revealed insignificant correlations between election outcomes and market performance in cases of single-party wins.
However, in instances of divided government, with different parties controlling the White House and Congress, three potentially significant outcomes were identified:
- Positive absolute returns surpassing long-term average returns:
- Democratic control of the White House and full Republican control of Congress
- Democratic control of the White House and split party control of the Senate and House
- Positive absolute returns slightly below long-term average returns:
- Republican control of the White House and full Democratic control of Congress
As we delve into monitoring the Election Watch in the upcoming months, it's important to recognise that several other elements significantly influence market performance. These factors include economic and inflation patterns, interest rates, individual portfolio asset allocation, security distribution, and diversification.
Moreover, Australian Sophisticated Investors who incorporate options in their portfolio strategy can generate income by implementing various methods. These methods include writing Index Spreads, Selling call options on specific shares, and preserving funds by Selling put options to establish long positions or gradually investing in stocks. If these approaches capture your interest, please consult with our Advisers.