Year-End Cheer

Photo by Nathan Dumlao on Unsplash
Acuview Nov/Dec 2023

Figure 1: Stock Market Movement Schedule
Towards the middle of December, (most) equity markets around the world enjoyed strong rallies. Before looking at what drove that, let’s first take a round-the-world trip for a quick glimpse of how various indices, sectors and asset classes performed.
Round The World
Table 1 below is organised in ascending order on YTD (to 13 Dec 2023) showcasing the top and bottom two/three in each sector/asset classes (from S&P Global).
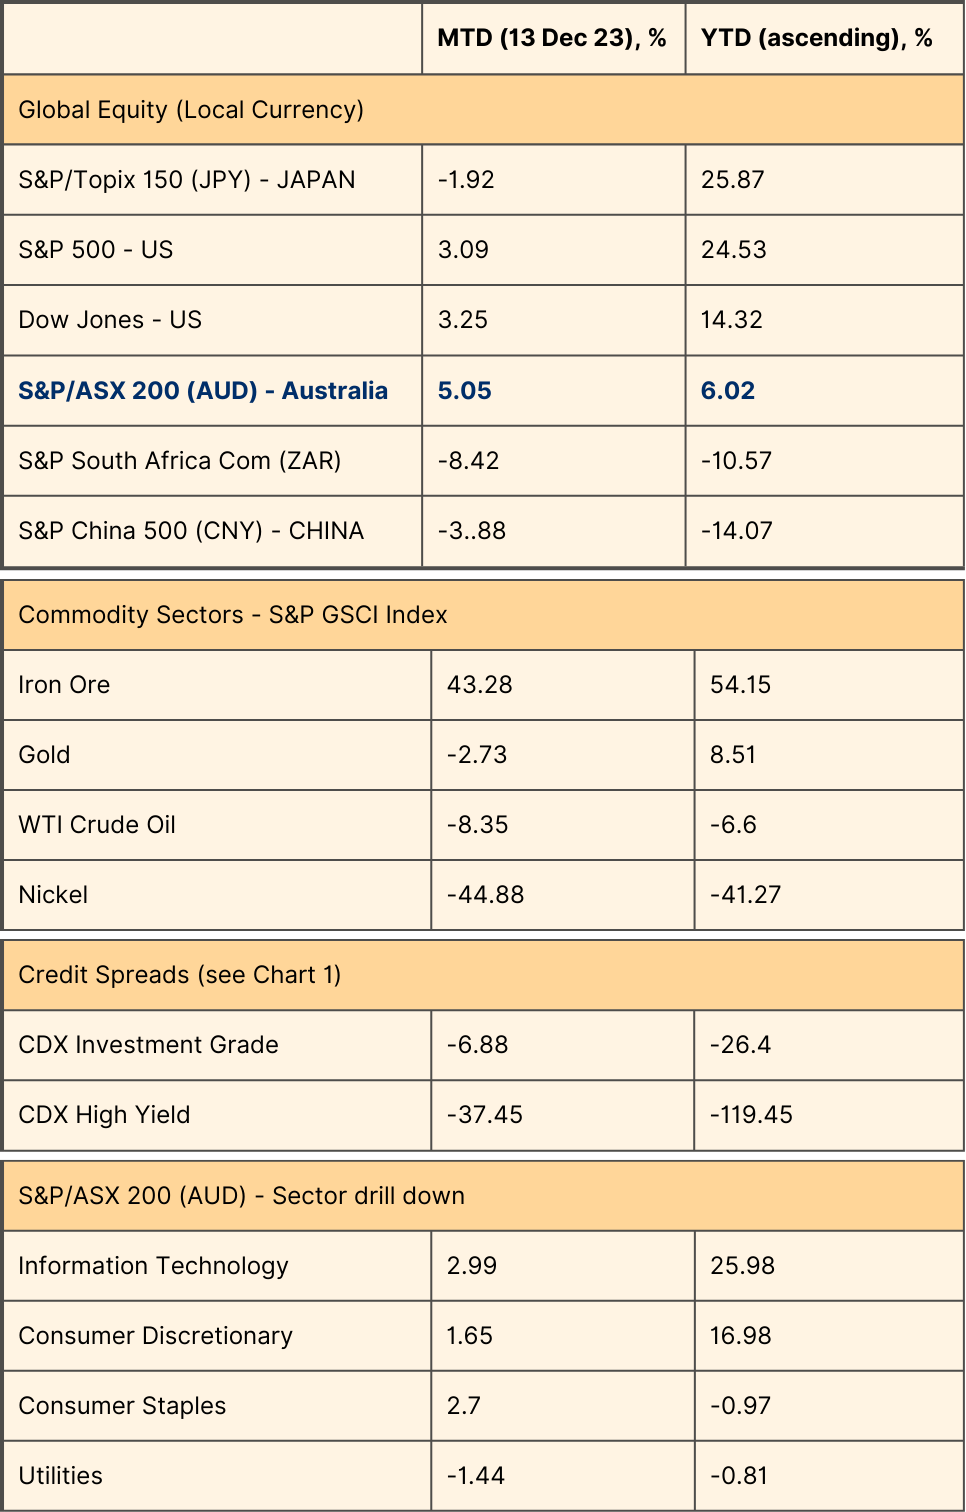
Table 1 Index Performances; Source: S&P Dow Jones Indices LLC and/or its affiliates, dated December 13 2023
Japan and US equities have performed strongly this year, with Australia catching up this month and China trailing at the bottom end of the leaderboard. In terms of commodity-facing equities the divergence between iron ore price and nickel, can’t be more stark. US Corporate Bonds’ Credit spreads have tightened progressively over the year as interest rate expectation adjusted downwards as observed in Chart 1 of the Credit Default Swap (CDX) of various Corporate Bond sectors.
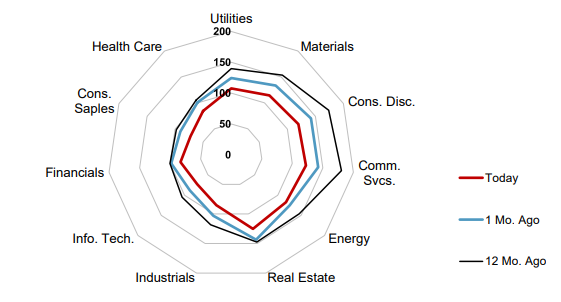
Chart 1: S&P 500 Bond Sector Option-Adjusted Spreads (OAS); Source: S&P Dow Jones Indices LLC and/or its affiliates, dated December 13 2023
We have seen recovery in the Australian dollars as speculation of our peak rate cycle is still on the table. Table 2 below shows the performances of some of the major cross rates.
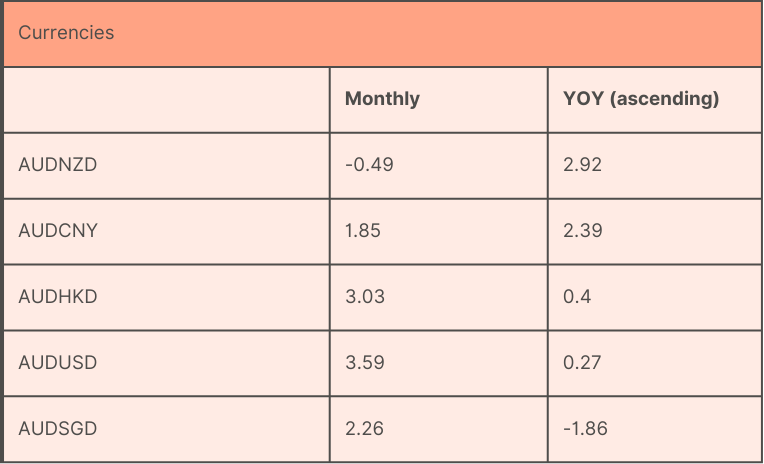
Table 2: Currencies with AUD being the Base Rate; Source: Trading Economics, latest interbank exchange rate as of 16 Dec 2023 12am UTC close
Table 3 depicts the top and bottom two commodities with gold price in the middle of the pack. The collapse in lithium price had been severe in 2023.
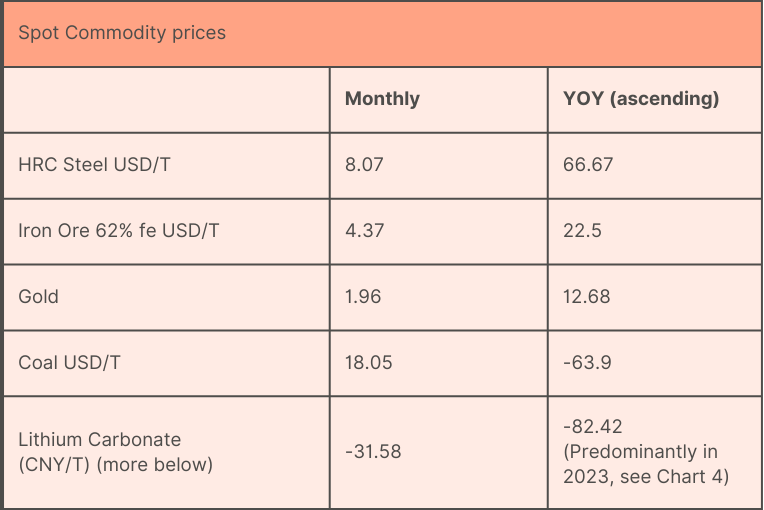
Table 3: Commodity prices; Source: Trading Economics, last updated Sunday December 17, 2023.
It is interesting to note that the worst performing commodity (lithium) coincides with the worst performing equities index (China) in 2023. Let’s have a little drill-in to see what has happened.
Lithium
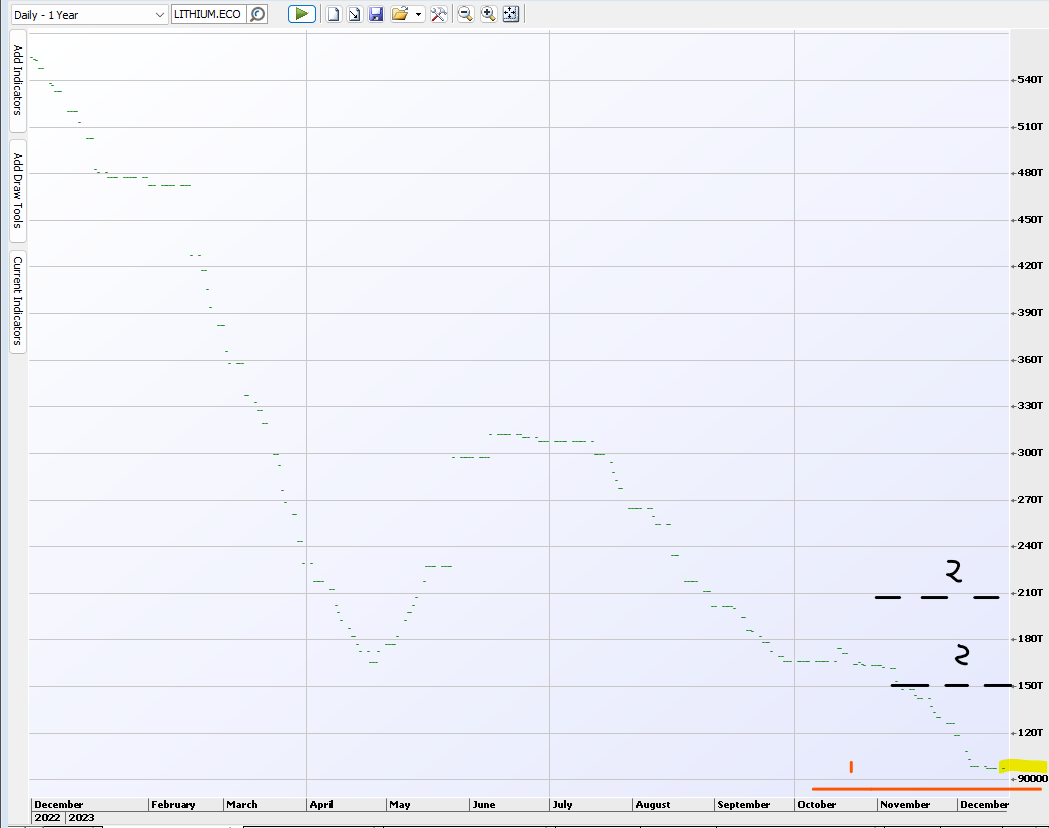
Chart 4 shows the severity of the price fall in lithium carbonate (battery grade, CNY/t) since the beginning of 2023. They look quite similar for Lithium hydroxide and spodumene prices.
Lithium carbonate 99.5% Li2CO3 min, battery grade, spot price range exw domestic China, yuan/tonne
Chart 4: Lithium CNY/T - Daily, 15 Dec 2023 (CNY97500/US$13,716/t); Source: IRESS
Compare that with the pattern of the Chinese equities index as expressed by the IZZ ETF, see Chart 5.
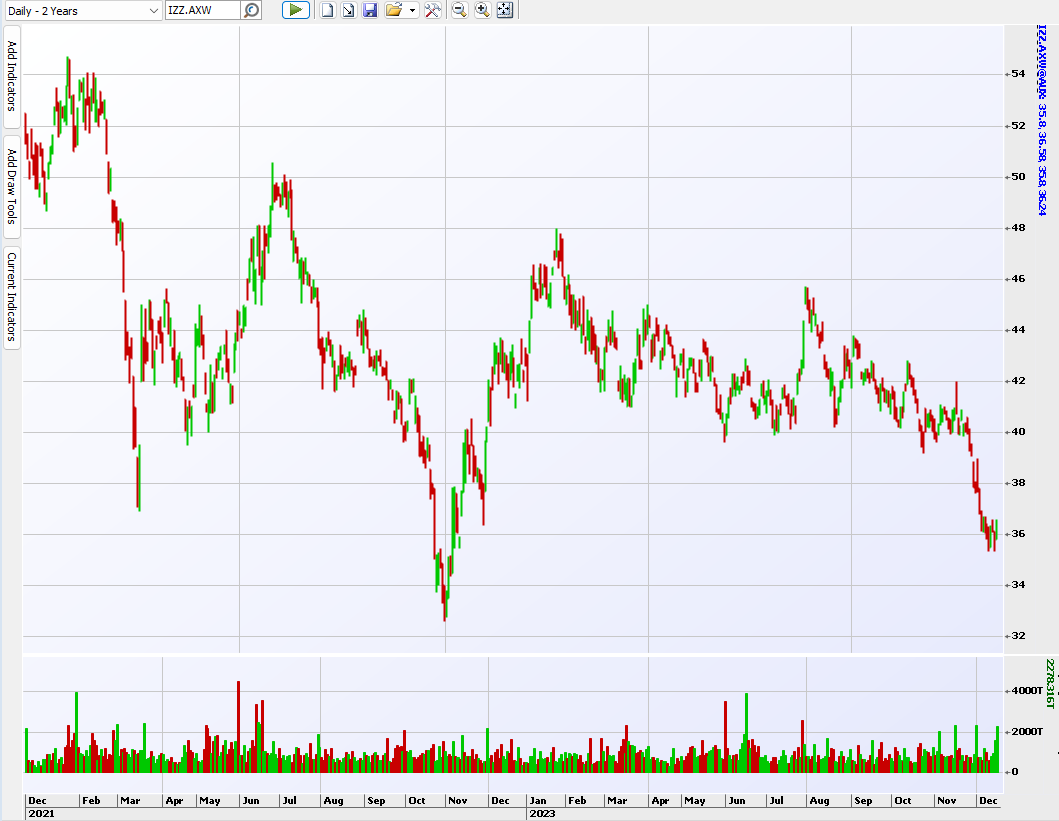
Chart 5: Chinese market as expressed by IZZ.AXW, ishares China Large-Cap ETF; Source: IRESS, 22 Dec 2023
Some of the contributing factors to the fall in lithium price include:
1. Supply surplus in 2023 and moving into 2024 as well.
Goldman Sachs estimates that global lithium hardrock supply to increase by 613kt LCE (Lithium Carbonate Equivalent) over 2022-2024. This pushes up oversupply in 2024 to around 200kt (Chart 6). Another industry forecaster, Benchmark Mineral Intelligence* expects the supply market returning to a deficit in 2028 with expectation of price adjusting upward at least 12 months prior. *https://source.benchmarkminerals.com/Source
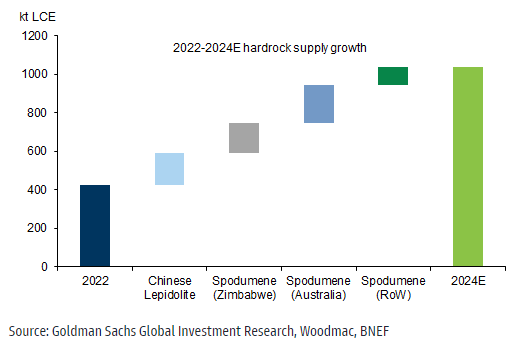
Chart 6: increase in LCE supply from 2022 to 2024
2. Slower demand growth in EV.
Two factors seen contributing to this - the phasing out of Chinese subsidies in EV and the lower economic growth in China which reduced consumers’ appetite for EVs. EV output grew quicker than demand in 2023 with 1.82m units produced vs retail sales of 1.5m units YTD (according to Goldmans’ research, Chart 7). For greater insight to expected demand for EV, see China’s Economics below.
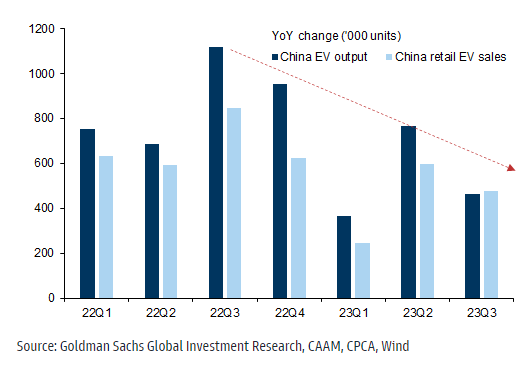
Chart 7: phasing-out of subsidies plus slower pace of EV demand
Where to from here?
The outlook for lithium price divides the market. On the lower end, we see Goldman forecasting a 12 month price target of RMB 88,875/t from current’s RMB 97,500/t (8.85% lower), see Chart 8 and the red line marked 1 on Chart 4.
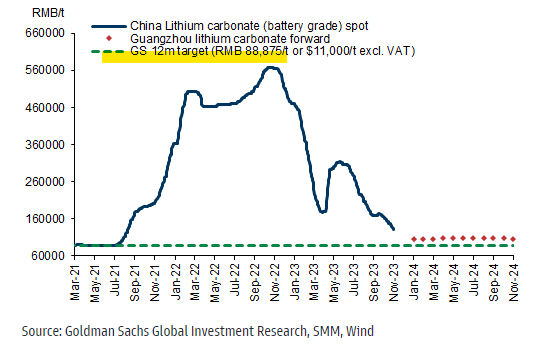
Chart 8: Goldman Sach’s lithium price forecast.
If you were to cast your eye back to Chart 4, you will notice two black lines across the chart at the right bottom corner, marked with 2. Those are the price expectations of two other market participants, at around CNY150000/t (54% higher) or more than doubling to CNY210000/t from 15 Dec’s price of CNY97500/US$13,716/t respectively.
China's Economics
As reported at Table 1, investing in China had been very challenging in 2023 as China experienced its bumpy recovery and some stimulus induced rallies that failed to ignite.
Post a weak Sep23 quarter (see Chart 9), the consensus for China’s GDP growth in 2024 is a moderate growth rate of 4.5%.
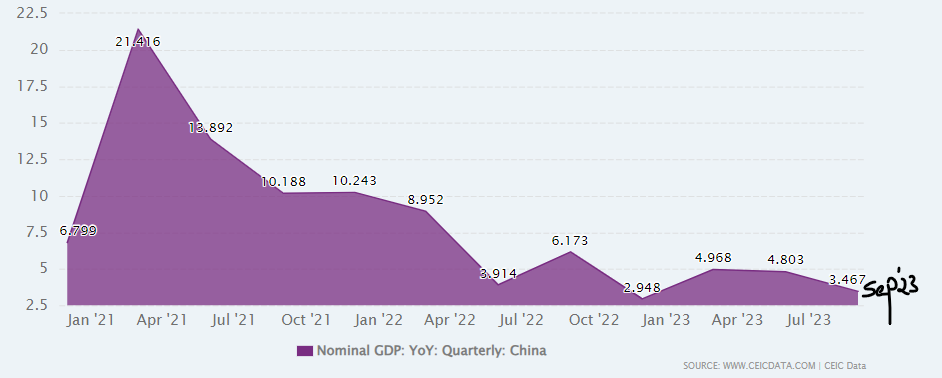
Chart 9: China’s Nominal GDP Growth
Deflation was a feature of the economy with subdued demand (like in pork, household appliances), overcapacity (increased supply competition, rents) and falling commodity prices (like energy). They are a reflection of consumption downgrade, housing demand shrinkage and deflation pressure in agricultural products, durables and housing rents. Consumption is expected to recover (slowly) across the various sectors as depicted in Chart 10.
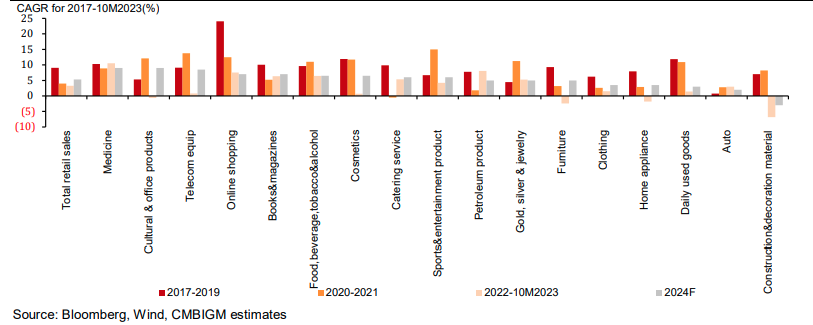
Chart10: Retail sales growth by industry
Consumers’ confidence and willingness to consume play a big role. Unfortunately they are staying low, see Chart 11.
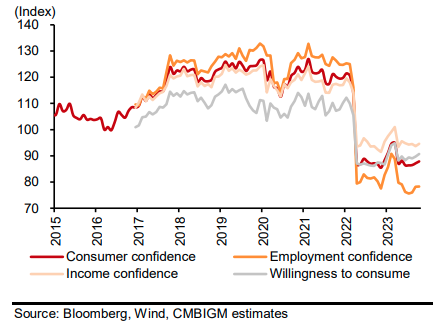
Chart 11: Consumer Confidence and willingness to consume
This sluggishness can be jolted by policy easing. Hence there is an expectation of the lowering of China’s RRR rate, may be by two times from the current 7.4% (see Chart 12).
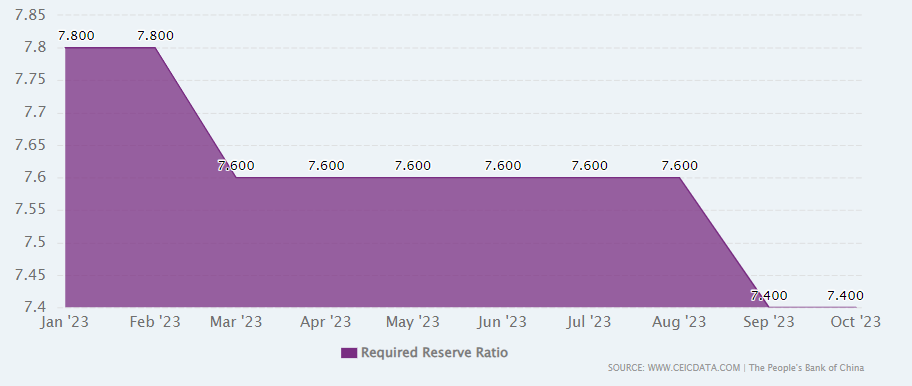
Chart 12: China’s Reserve Requirement Ratio to Oct 2023
China’s property sector, another key area (with implication to some Australian equities) has continued its downturn in 2023 and in 2024, is expected to continue being challenged albeit at a smaller percentage. Gross Floor Area (GFA) sold, GFA started and property development investment are expected to drop 5%, 10% and 7% respectively by a HK broker vs the worse numbers of 7.8%, 23.2% and 9% in 2023.
Strong rebound in sales in 2024 is not expected either. See estimations in Chart 13.
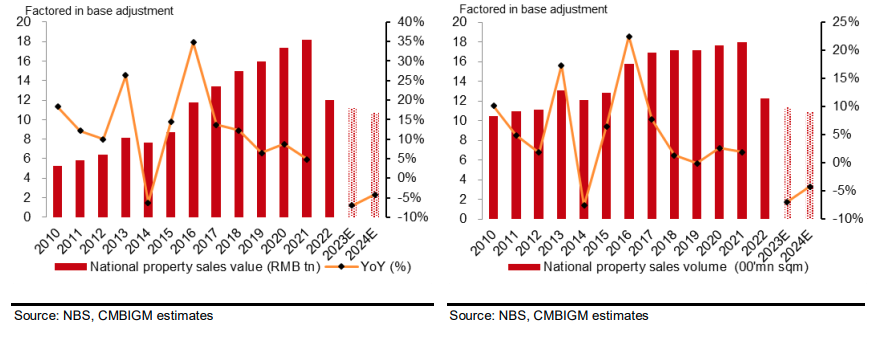
Chart 13: National property sales value and volume estimation
Hence it is expected that China will have to loosen its property policies, for example credit supply (aiding developers’ refinancing) and additional cut in its 5Y Loan Prime Rate to encourage the very dispassionate consumers.
The EV market is another sector in China that has implications for selective Australian equities. China is expected to expand its global footprint in EV, from its share of 57% in 2022 (Chart 14).
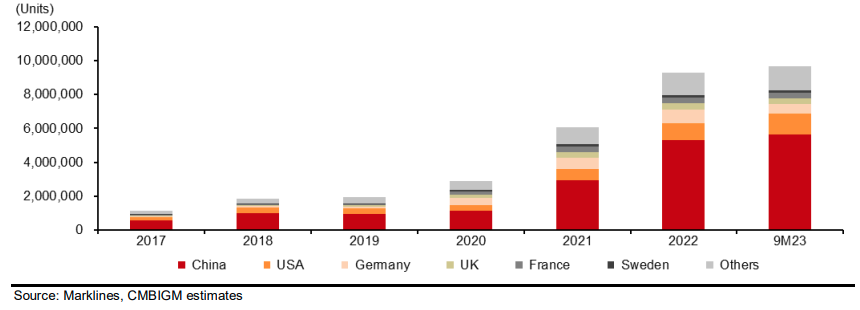
Chart 14: NEV sales volume by country
One HK broker is observed to be projecting China’s passenger New Energy Vehicle (NEV) retail sales to rise 21% YoY from 7.4m units in 2023 to 8.9m units in 2024, with wholesale sales similarly higher by 24% to 11m units in 2024. The industry landscape is complex but the expected growth is at least supportive of demand for lithium and its price.
Coming back to the year end cheer…
What Drove the Year-End Equities Market Rally?
This sentiment can best be described by Chart 15 where Federal Open Market Committee (FOMC) members in the December Summary of Economic Projections indicate that rate hikes are done and a cut of 75bp is expected in 2024.
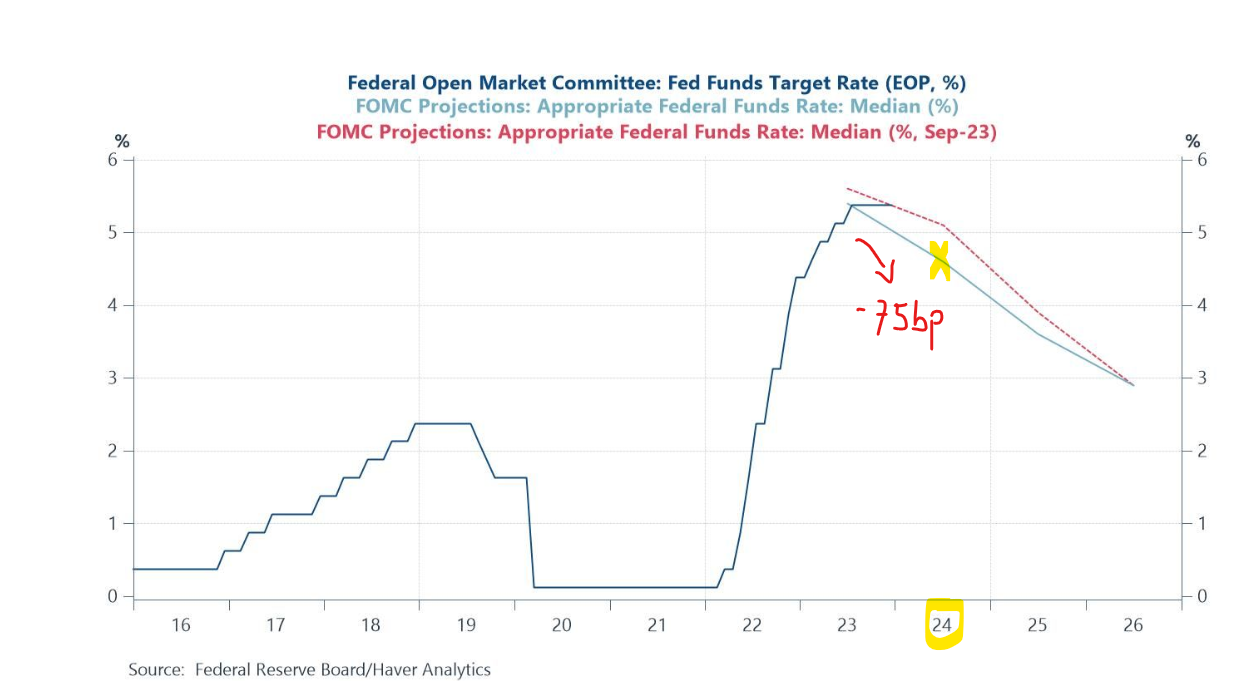
Chart 15: FED target rate
US Treasury yields followed suit in reversing down quickly (Chart 16 depicted 10 years’).
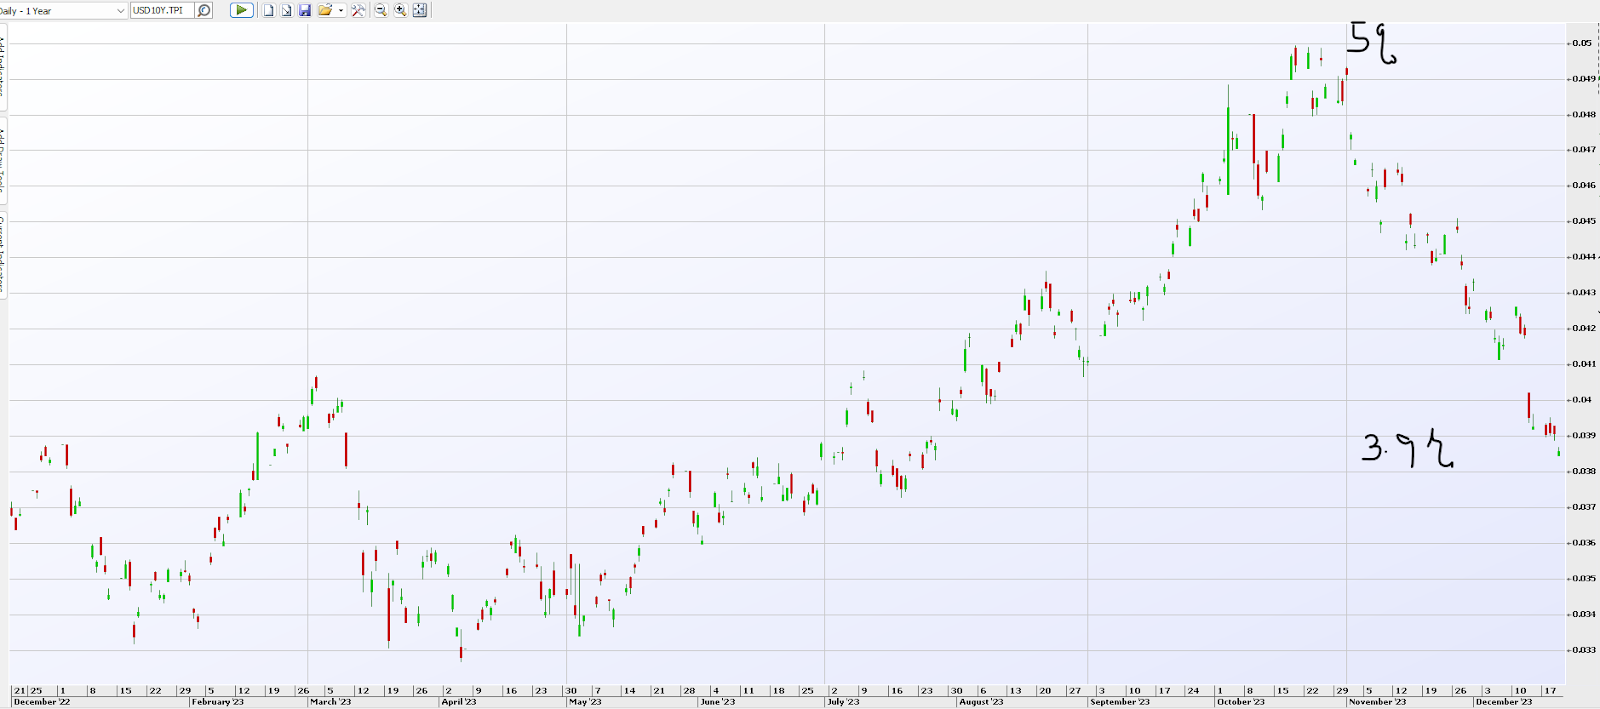
Chart 16: US 10 year Treasury Yield; Source: IRESS
Investors reacted by pushing up both the bonds (as yield falls) and the equities market with a more optimistic view of expecting more, speedier and earlier (Q1in 24 instead of Q2).
However, it’s not just about the cut. More importantly it is the reason for the cut.
Take a look at Chart 17. There are two possible glide paths for the cut. Top green arrow is a cut due to inflation grinding down naturally in a low growth environment, whilst the second red arrow path depicts a cut due to significant deterioration in economic growth or some financial shock.
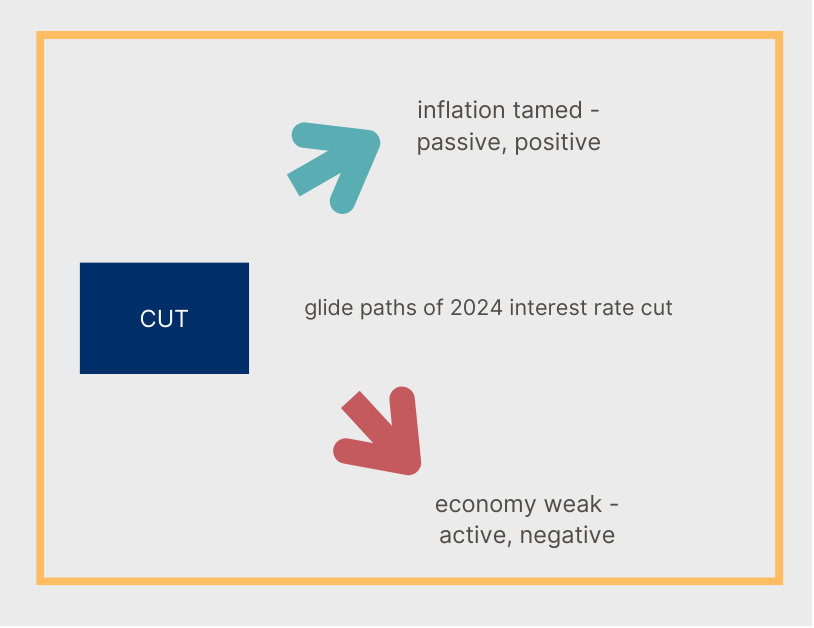
Chart 17: Possible interest cut glide paths in 2024; Source: Acumen Money
The glide path traversed shall inform how we position portfolios for 2024.
Currently, the top green glide path is the expectation of equities markets. The latest expectation of Q423 GDP growth which has improved to 1.6% from the 1.2% of the previous weekly survey (see Chart 18) is giving more optimism of the top glide path, slower growth that tames inflation.
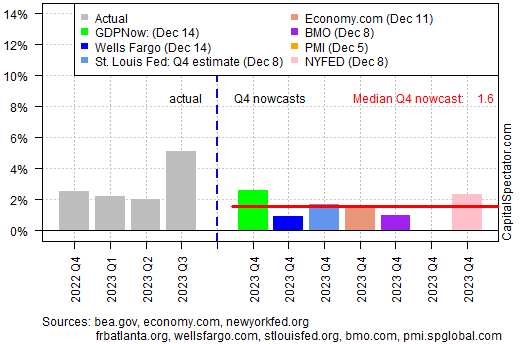
Chart 18: US Real GDP Change, Actual vs Expectations for Q4 2023
If the top glide path is to play out, i.e. falling bond yields (or higher bond prices), lower US dollar and positive equity market, then Chart 19 is very helpful in helping guide how various asset classes may perform one year after, based on past five rate hike cycles.
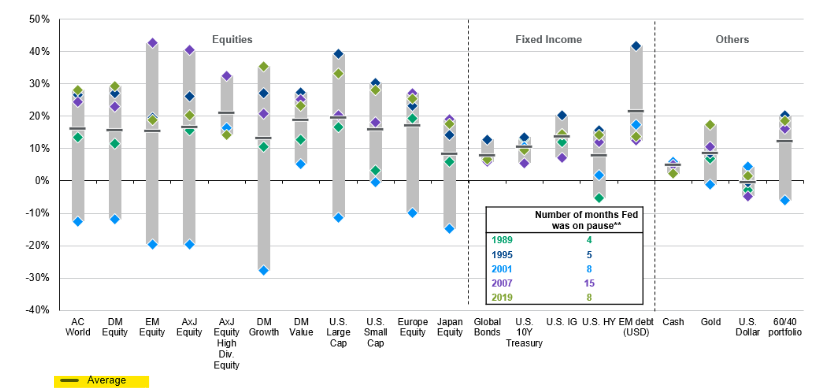
Chart 19: Asset class returns following the end of rate hikes; Source: FactSet, U.S. Federal Reserve, J.P. Morgan Asset Management
From the chart above, we could observe several potentials (of asset class performance post hikes). Equities continue to be doing well, perhaps more so in growth stocks with good earnings aided by low interest rates. In Fixed Income, lower USD helps move funds towards Emerging Markets (particularly in Debt) and finally in the Other category, the 60/40 Equity/Bond allocation is finally back after a two year hiatus (or of correlating with equities) where an allocation to bonds with various flavours (High yields, Corporate) complemented by equities may provide a good balanced outcome for investors.
For investors who use options as part of portfolio strategies, income generation (and moderate hedging) is likely to remain a mainstay as we move into 2024.


