The story continues in May

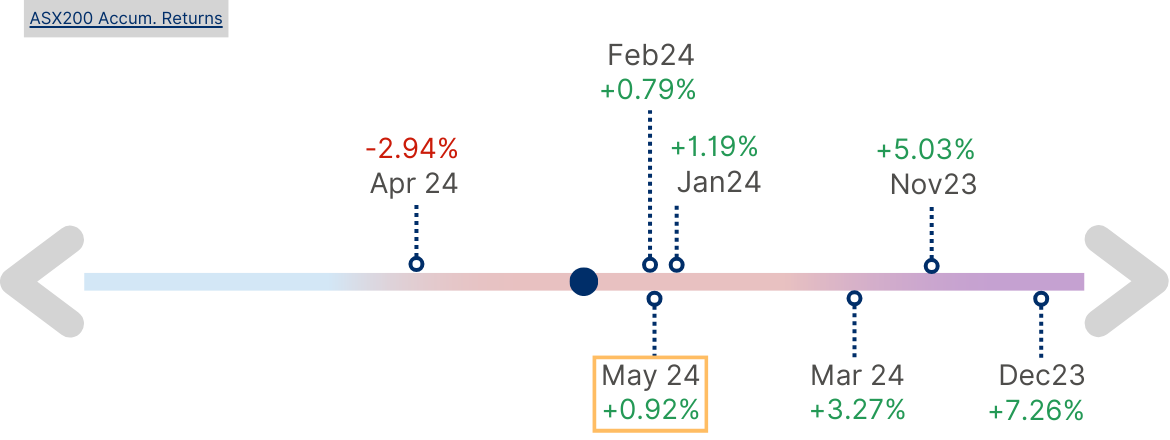
Figure 1: Stock Market Movement Scale
AcuView May 2024
What's been moving?
a. Exploring Factors
Factor Investing involves selecting securities or constructing portfolios based on specific characteristics or behaviours, known as Factors. Common Factors include Momentum and Volatility (which are derived from historical movement of security prices), Size (Market Capitalisation), Value (from reported financial metrics) and Quality (from earnings metrics plus qualitative analysis).
Factor-based Managers generally use pre-programmed mathematical formulas, built into quantitative systems that continuously calculate these Factors from security datasets. This strategy allows for a more systems-based investment decision making and is a diversification from other styles of investing, like sector, region or Index selections.
Factor investing has the potential to boost portfolio returns by detecting particular market trends or behaviors. Moreover, factor analysis can establish the basis for a methodical approach to selecting securities, like the Multi-Asset Portfolio utilised by clients of Acumen Investors. Factor Managers are skilled at identifying influential market factors, choosing corresponding securities, and optimising fund allocation to enhance portfolio returns while managing risk effectively.
b. Does Factor investing work?
Research indicates that over a 24-year period, the Momentum factor (described more below) added an extra 1.6% in excess returns to portfolios, while the Size factor (smaller cap stocks) showed a superior performance with 2.9% in excess returns during the same timeframe. Whilst Value, which is the buying of undervalued securities or those trading below their intrinsic values, added about 1% in excess return.
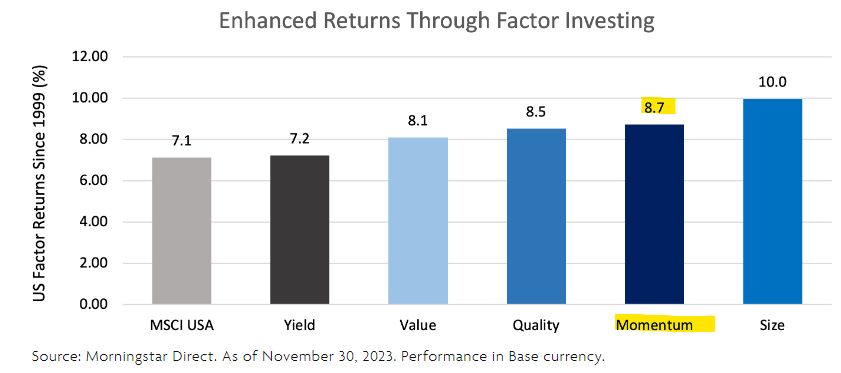
Chart 1: Enhanced returns through Factor Investing; Source: CI Global Asset Management
It's essential to understand that not all factors are appropriate for every situation. Choosing the correct factor can add value and make a significant difference.
c. Not one for all Season
Chart 2 below depicts the performance of the S&P 500 Index, by Factors. The stand out this year (and in the last 12 months), which will not be a surprise, has been the Momentum Factor. Stocks that exhibit strong Momentum (M) Factors are those that are persistent in their trend and Quality (Q) are stocks that demonstrate earnings resiliency or strong profitability, during the measured period.
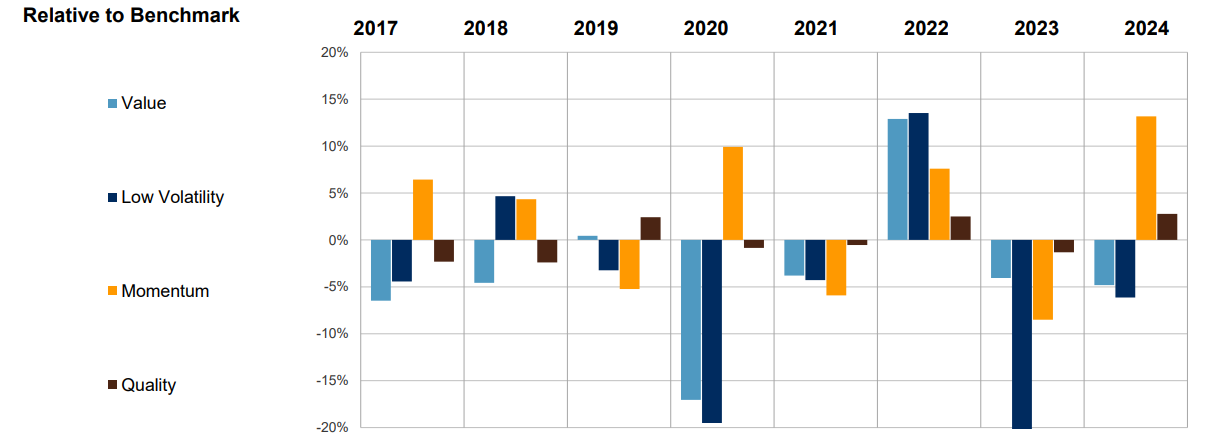
Chart 2: S&P 500 Performance from 1 June 2017 to 31 May 2024 by Factors; Source: S&P Dow Jones Indices LLC and/or its affiliates. Data as of May 31, 2024. Returns in U.S. dollars, IRESS
For additional insight, we have plotted the performances of three Factor ETFs – Momentum (MTUM), Quality (QUAL), and Size (SIZE) – against the MSCI World Index in Chart 3. The timeframe aligns with Chart 2, spanning from 2017 to 2024.
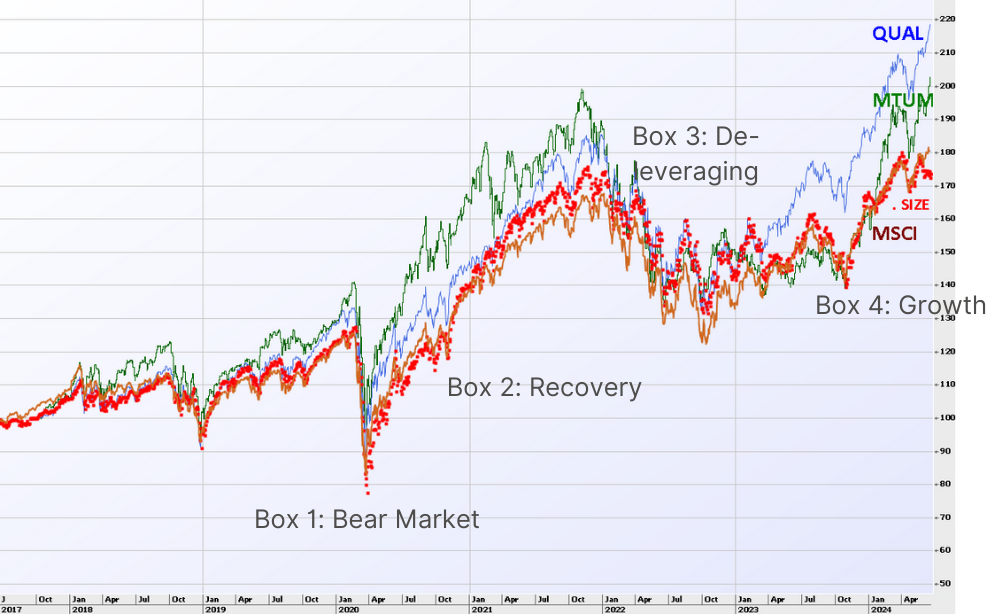
Chart 3: Common Base pricing for MSCI, QUAL, MTM and SIZE ETFs for period 2017 to 2024; Source: IRESS, Acumen Investors
Our observations are as follows:
1. All Factors fell when markets plunged in late 2019/2020. Particularly Size, small caps perform worse in bear markets. The Factors that would have held up better are Low Volatility and Quality stocks as investors “hide” in stocks that are less affected by market sell off (Table 1). Based on the analysis of Research Affiliates’ spanning from 1999 to 31 Dec 2020 capturing four economic cycles, they found below during the period of Contraction:
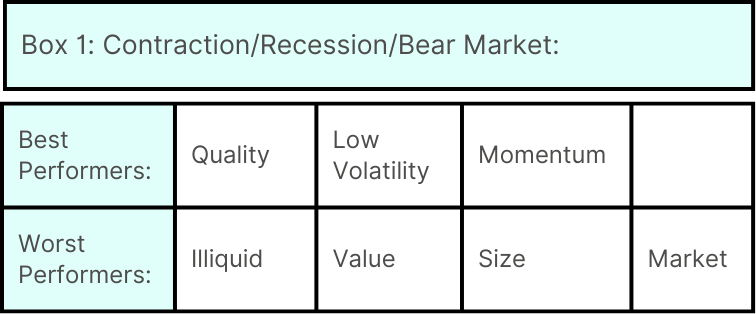
Table 1: Contraction Factor Performers; Source: Research Affiliates
2. Referring to Chart 3 again, as markets recover in 2020 and continue to rise in 2021, Market Factor was the strongest benefiting from positive price movement. The outlier though was the Momentum Factor which performed strongly, though according to history (Table 2), it is not supposed to. This demonstrates that Factor investing is not an exact science, as current outcomes may differ from historical data.
3. Size which according to Table 2 should outperform, only caught up in the later phase of recovery in 2021.
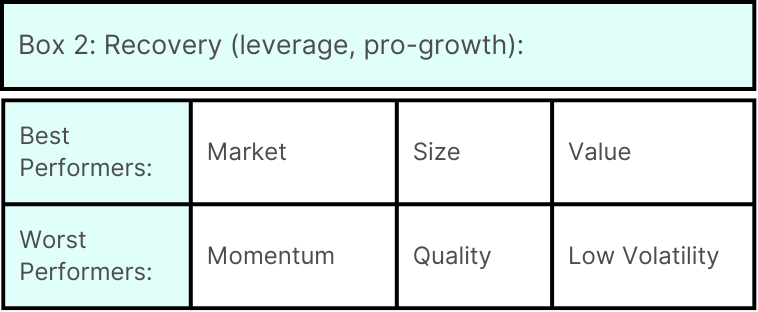
Table 2: Recovery Factor Performers; Source: Research Affiliates
4. In 2022, as markets reversed (as rate hike cycle began), it was Value and Low Volatility stocks that investors gravitated towards (consistent with Table 3).
5. Though Momentum was supposed to outperform in a slowdown (as a counter move), in 2022 MTUM ETF did not. This goes to show that an investor may have picked the right Factor, the selection of the specific instrument is equally important to benefit from the view.
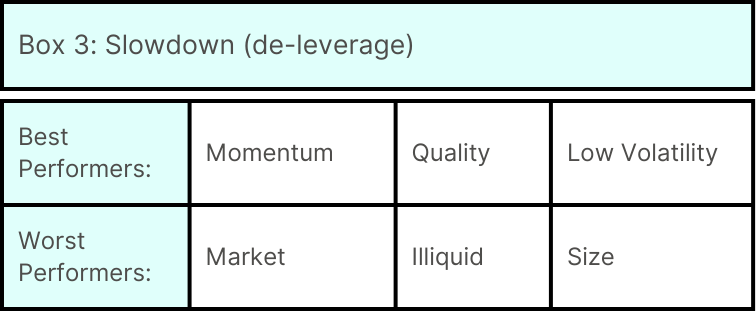
Table 3: Slowdown Factor Performers; Source: Research Affiliates
6. In the latter part of 2023, we see a break away of Quality whilst Momentum bite time. Only towards 2024 that Momentum start to break up as well.
7. As 2024 rolls on, Size (small cap stocks) have not enjoyed similar proportion of outperformance.
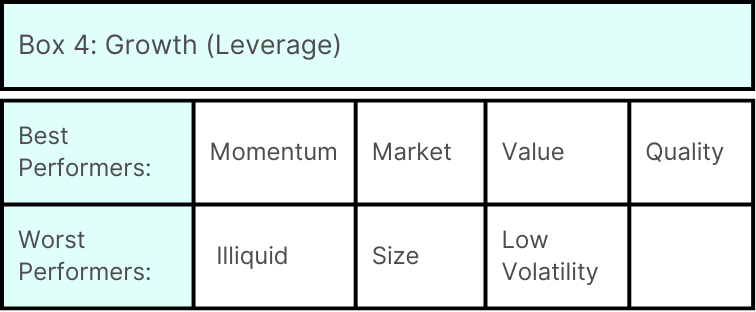
Table 4: Growth Factor Performers; Source: Research Affiliates
The observations above indicate that Factors can enhance portfolio returns, but they are not foolproof, not dissimilar to other investment strategies. At times, they may not align with historical patterns, as commonly experienced in investing. Strategies exist to address these disparities in performance.
d. Factor Strategies
1. Factor Rotation
This is a common strategy that involves adjusting factors based on their performance during various market cycles. For example, using the above-mentioned single Factor ETFs and rotating them according to cycles.
2. Factor Blending
This is where several Factors are used at the same time, but with different weights. Blackrock manages an ETF specifically designed for Factor-blending, ticker DYNF, a US Equity Factor Rotation ETF. Diagram 1 below gives insight into Factors the Manager is currently in position for. You will notice the current Factors favoured are Quality, Momentum and High Growth.
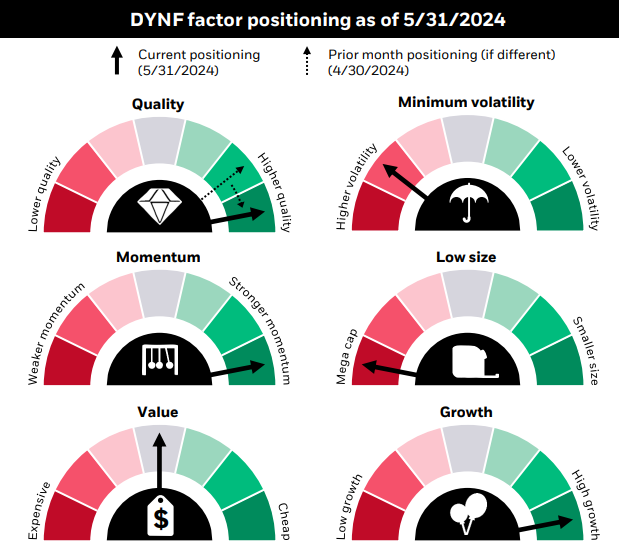
Diagram 1: DYNF; Source: BlackRock as of 5/31/2024. Factor positioning is illustrated by qualitatively categorizing DYNF’s exposure to factor characteristics vs. the S&P 500 Index.
Note: This information should not be relied upon as research, investment advice or a recommendation regarding the Funds or any security in particular. This information is strictly for illustrative and educational purposes and is subject to change. Past performance does not guarantee future results.
Another Manager uses blending differently. CI Global Asset Management manages the U.S. Enhance Momentum Index ETF with the ticker CMOM.B. This relatively new ETF (listed only in January of 2024) is a blend of 60% risk-adjusted time-weighted Price Momentum plus 20% Earnings Momentum and 20% Quality, screening out securities that are low is earnings quality.
3. Factor Stock Selection
Factor analysis is also utilised in the selection of individual stocks. This method involves assigning scores to stocks based on various factors such as their characteristics, historical stock price movements, or demonstrated financial metrics from the past.
Let’s delve into the Factor scores of a few ASX stocks analysed through Factor analysis by Resonant Asset Management.
Wisetech, listed as WTC, is an Information Technology company with its highest Factor score in Quality, followed by Growth. The notably low score in Momentum was somewhat unexpected, given the perceived Momentum status of tech stocks, while the negative score in Value aligns with expectations. Factor analysis has highlighted Wisetech’s attributes of superior quality of earnings and growth potential for its exceptional performance in 2023 and 2024.
On the flip side, APA, a utilities stock with distinctive characteristics different from a tech stock, displayed Growth as its primary Factor. During an expansionary period, a Growth Factor stock would typically have performed well. However, APA saw a decline of over 20% since 2023. This decrease can be linked to its high level of gearing and its performance conflicting with the rising interest rate environment. This scenario underscores the risk of relying solely on one Factor for decision-making and emphasises the significance of a Manager's expertise in applying a qualitative approach and analysing a combination of Factor scores for a single stock. Following Growth, the subsequent factors for APA were as anticipated: Value, Quality, and a negative rating on Momentum.
e. What do the Factors say?
The insights and analysis provided lead us to a crucial question: Will Quality and Momentum continue to be key players as we enter the latter half of 2024? How can we anticipate the right time to rotate to the next Factor? Will Factor analysis aid us in predicting this shift?
Diagram 2 below illustrates Blackrock’s rotation signals. In 2024, we have observed both Momentum and Quality taking the lead. Historically, these factors have excelled during both the Expansion and Slowdown phases. The stocks showing momentum during this cycle also exhibit Quality. Could this suggest that as the economy decelerates, the resilience of the Quality Factor might persist, surpassing Momentum? This potential scenario could be unfolding at the top right of Chart 3.
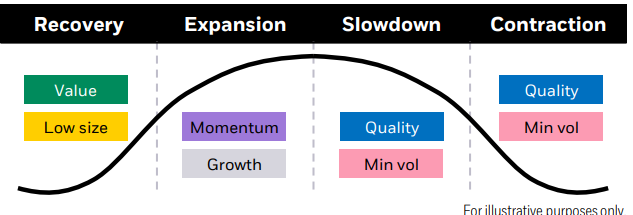
Diagram 2: Rotation signals based on economic cycles; Source: Blackrock, Morningstar as of 5/31/2024.
Turning to the NAAIM (National Association of Active Investment Managers) Exposure Index can provide insight into the sentiment of market professionals. This index represents the average portfolio exposure to U.S. equity markets as disclosed by the association's members.
The latest weekly reading of the Exposure Index, which stands at 86.3, suggests that investment managers are not exposed at extreme levels. As this Index is often used as a contrarian signal, it does not show excessive optimism, hinting that the US market might not have peaked yet.
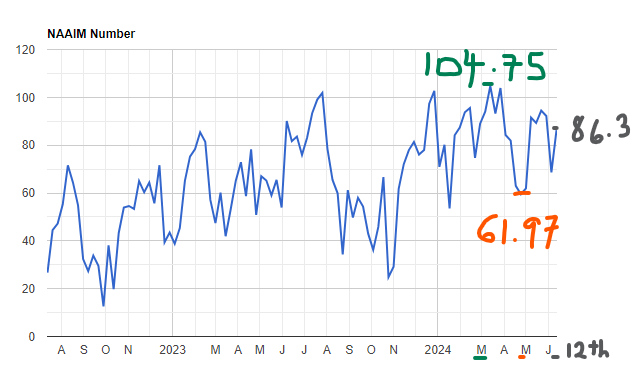
Chart 4: The NAAIM exposure Index as of 12 June 2024; Source: NAAIM
What will move markets?
a. Households
The primary driver of market trends in the latter part of 2024 remains the ongoing question of "Are we there yet?" regarding the anticipated initial rate cut in the US and Australia. As long-term rates remain elevated, household savings in both countries are gradually depleting. US household savings rate in April was at 3.6%, same as March but much lower than previous year’s 5.2% and long term average of 8.46% (Chart 5). Whilst in Australia, the latest Mar24 quarter registered a decrease from 1.6% from previous quarter to 0.9%, mainly due to consumption outpacing income (Chart 6).
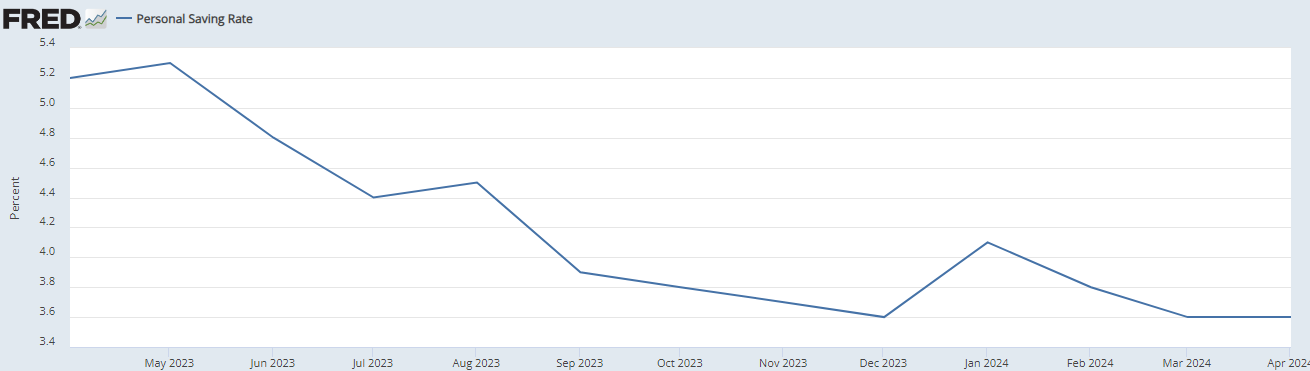
Chart 5: Personal Saving Rate; Source: FRED Economic date St Louis Fed, April 2024
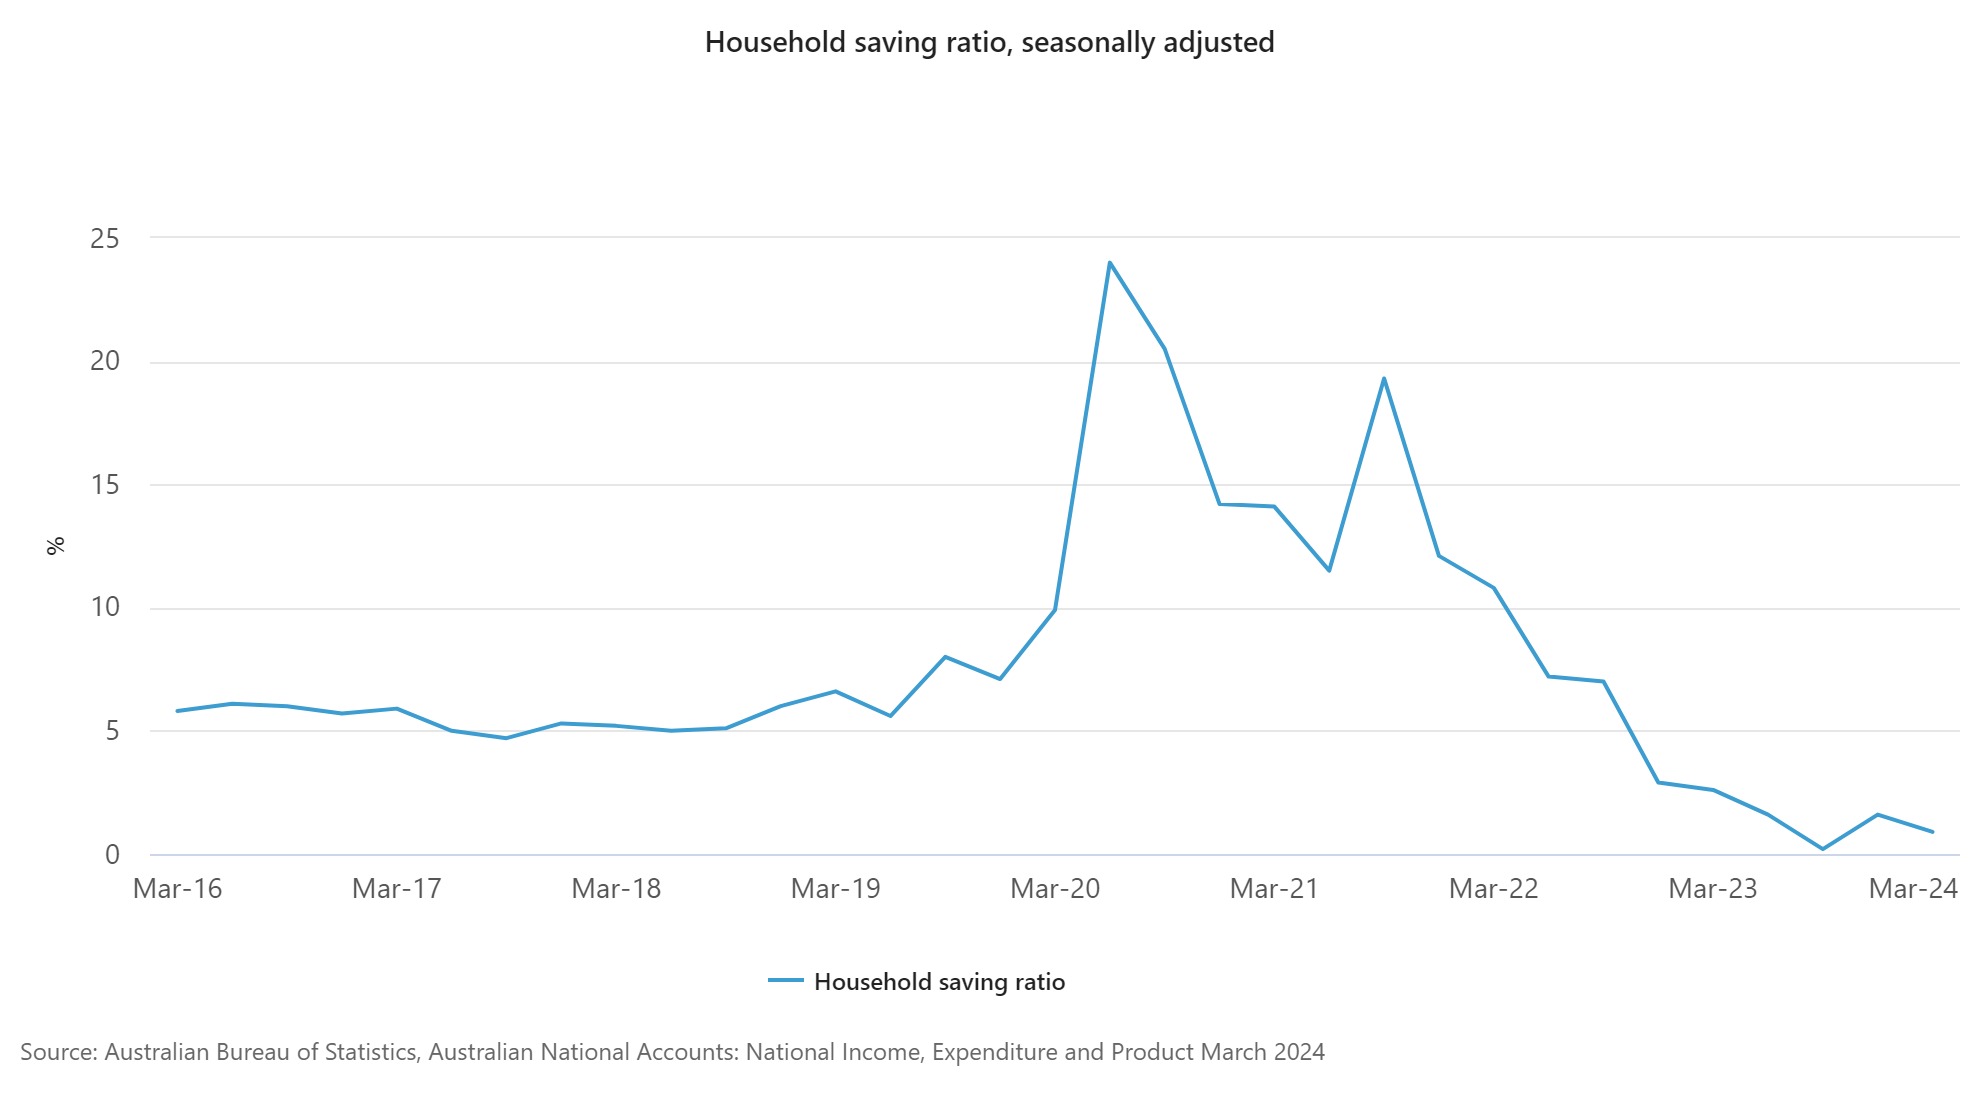
Chart 6:Household saving ratio, seasonally adjusted; Source: ABS, Mar24
b. Corporates
Corporate Australia has seen an improvement in business investments in 2024, despite the high interest rate environment. This development is a positive sign towards the expected, slower pace ongoing economic growth.
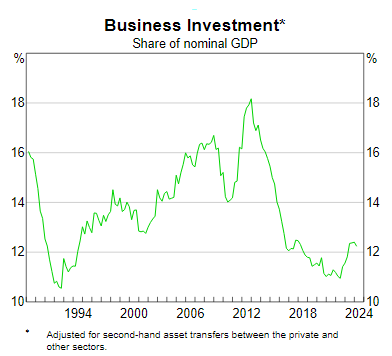
Chart 7: Business Investment; Source: ABS, 19 June 2024
Chart 8 illustrates that when it comes to business lending, the mining and engineering sectors have primarily accounted for borrowing related to machinery and equipment requirements.
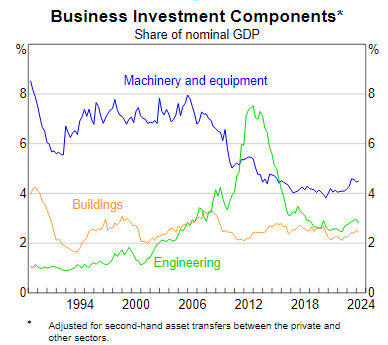
Chart 8: Business Investment Components, Share of nominal GDP; Source: ABS, 19 June 2024
The resiliency of larger corporations is supported by their access to more favorable borrowing rates compared to smaller businesses, which are often linked to Australian households. Chart 9 demonstrates the disparity in borrowing rates for smaller businesses.
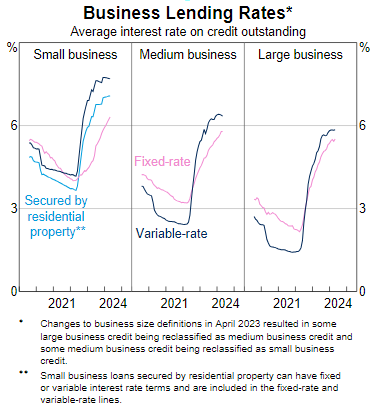
Chart 9: Business Lending Rates; Source: ABS, APRA 19 June 2024
To enhance household liquidity, encourage business investment, and stimulate economic growth, it is essential to lower interest rates. The challenge arises from inflation, which has risen but is showing slow signs of decreasing. Another critical element affecting Australia's economy and the ASX resource stocks' performance is the mining sector, which has been a significant contributor to GDP growth (Chart 10). China's economic recovery is also closely watched. The People's Bank of China (PBOC) has taken steps to boost its economy. The question remains: are these measures sufficient?
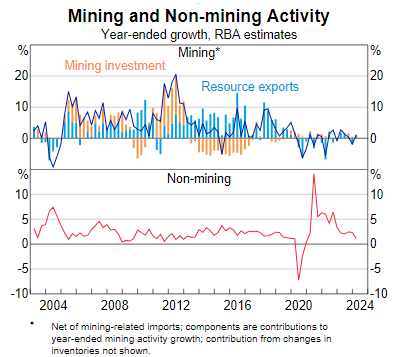
Chart 10: Mining and non-mining Activity; Source: ABS, RBA 19 June 2024
c. Other economies
China's approach to boosting its economy hinges on the Federal Reserve's future actions too.
Consider the interest rate disparity between the two nations in Chart 11. If the Fed opts to maintain current rates while China decreases theirs to spur economic growth, the gap will widen, leading to further depreciation of the RMB against the USD. This scenario goes against the People's Bank of China’s desire for a stable RMB.
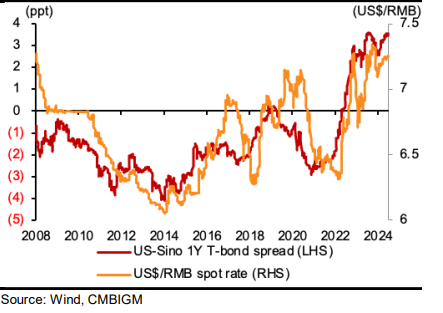
Chart 11: US-China interest spreads
On the other hand, falls in credit growth in China persists. As illustrated in Chart 12, both the M2 Money Supply (cash, cheques, deposits, etc.) and Total Social Financing (TSF) outstanding which are off-sheet loans, are still declining though conventional RMB banking loan seem to have stabilised. These continued falls result in reduced liquidity within the real economy.

Chart 12: China’s RMB Laon, TSF Outstanding and M2
A decrease in its RRR in July could potentially halt this decline. However, this remains an intricate balance for the PBOC of stimulating the economy and maintaining a stable RMB.
China has taken steps to stimulate the economy through other strategies. These are some of them and their early signs of impact:
- Introducing the appliance upgrade programs and e-commerce promotions during the recent Dragon Boat Festival (DBF) holiday. Retail sales recorded a pick up in most reporting cities and gradual improvement is expected as staple sales rebound and destocking ends.
- Holiday domestic and outbound travels recorded a surge whilst China’s effort in attracting inbound tourism has attracted foreign visitors (closer to home, Australians will soon be able to visit visa free for 15 days).
- Secondary property market sales have shown signs of improvement during recent DBF, supported by the PBOC's policies on lower down-payment ratios and mortgage loan interest rates reduction.
- Home purchase in larger cities has shown signs of a pick up in Chart 13, from abolishment of home purchase restrictions
- Encouraging local governments to acquire unsold commercial projects from developers in efforts to address oversupply
The PBOC does have other measures like further lowering the Loan Prime Rate to relieve household and private businesses debt burden. It can further guide banks to expand credit supply to boost economic growth and defy deflation pressure.
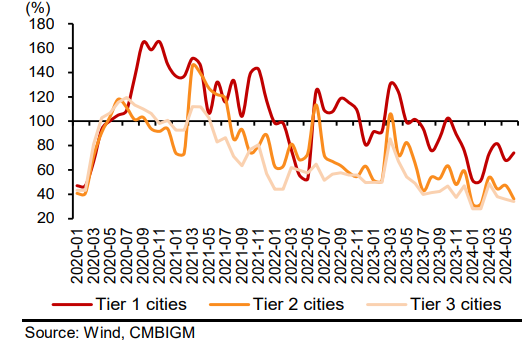
Chart 13: New housing Sales Recovery rates compared to 2018-2019 in 30 cities, dated 18June 2024
d. On the whole
The trend is that of lower rates (other than Japan from Chart 14), but Central banks do not seem rushed to reduce rates and are anticipated to proceed gradually.
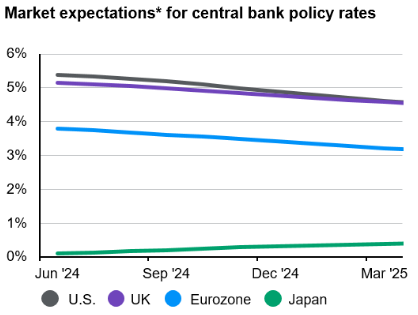
Chart 14: Market expectations of central bank policy rates; Source: Bank of England, Bank of Japan, European Central Bank, U.S. Federal Reserve, J.P. Morgan Asset Management; (Left) FactSet; (Right) Bloomberg L.P. *Expectations are based on overnight index swap rates. Past performance is not a reliable indicator of current and future results. Guide to the Markets – Asia. Data reflect most recently available as of 10/06/24.
In the second half of 2024, if global growth, inflation and interest rates synchronise in their moves, this can provide a peaceful symphony and stability to a slightly uptrend market. We remain watchful of these many moving parts, as beneath the surface Factor and Sector rotations continue.